
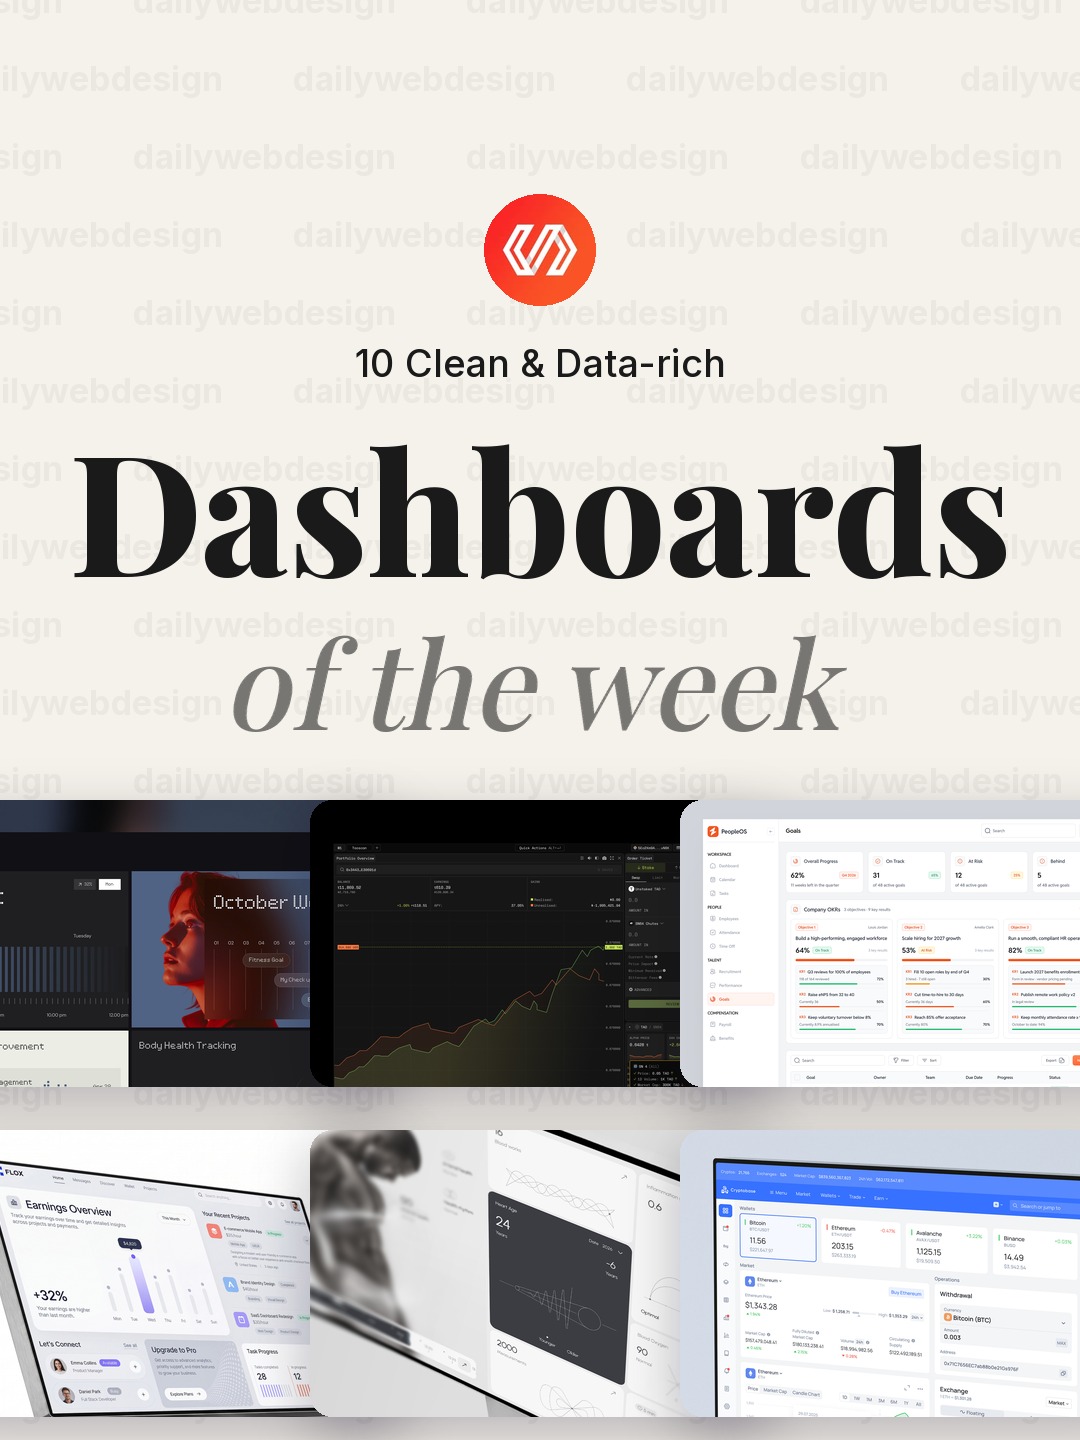
10 Clean & Data-rich Dashboards Designs to Learn From (October 2026)
A dashboard is useful only when people can find the next decision in it. This week’s Dribbble picks range from wellness and team goals to crypto, fraud monitoring, and fintech operations. Across those different jobs, the best ideas are the ones that make information easier to scan without hiding what matters.
1. Personal Wellness Dashboard UI UX Design by Pixelean
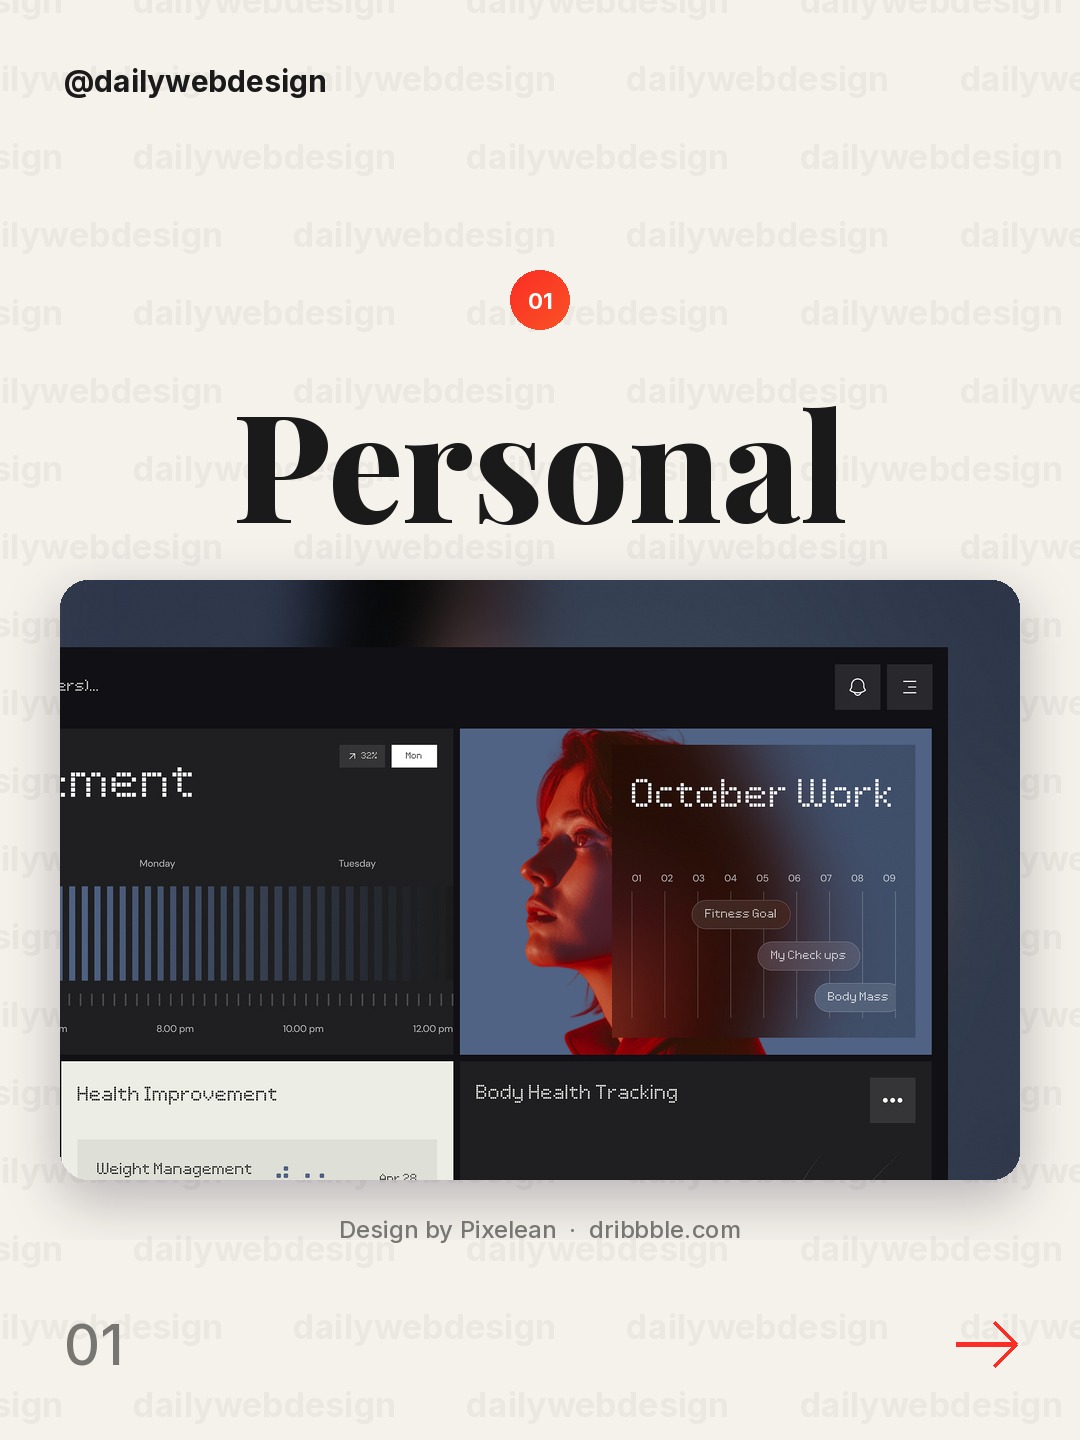
Design by Pixelean, via Dribbble
Use a calm wellness palette and give the main personal metric room to breathe. A small set of clear progress cues can make a health overview feel supportive rather than clinical.
2. Bittensor Blockchain Explorer — Crypto Analytics Dashboard UI by Demyanchuk Art Team
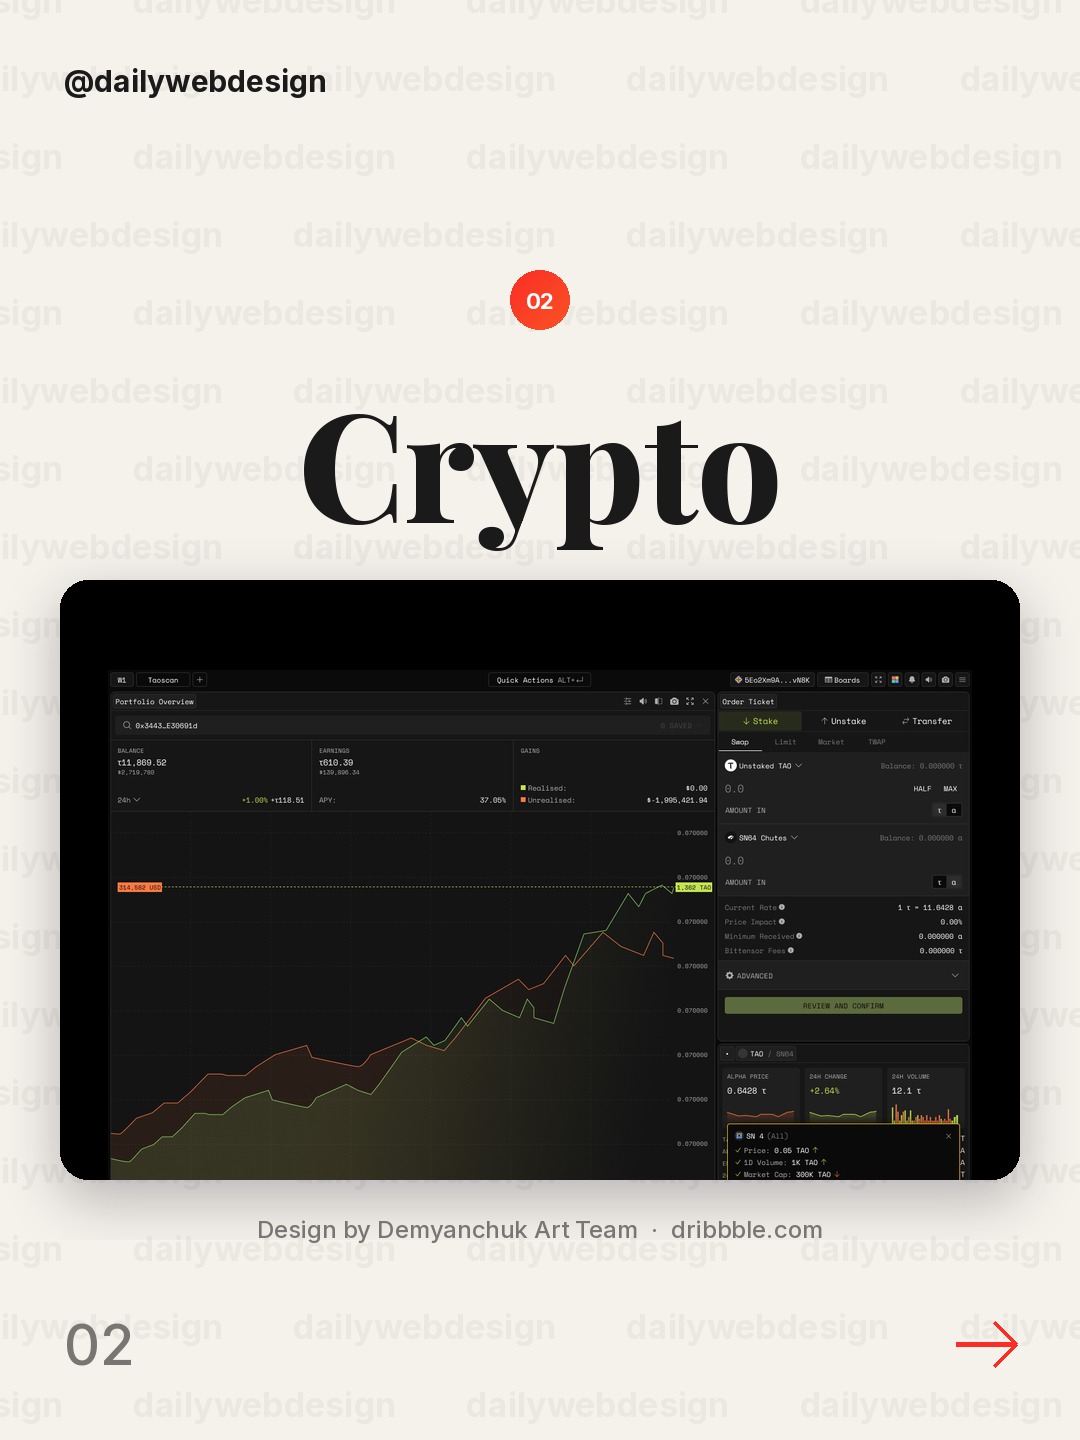
Design by Demyanchuk Art Team, via Dribbble
For a blockchain explorer, make the network activity legible before adding dense technical detail. Pair a strong overview with clear labels and let users drill into transactions only when they need them.
3. Team Goals dashboard PeopleOS by Awe Design Studio
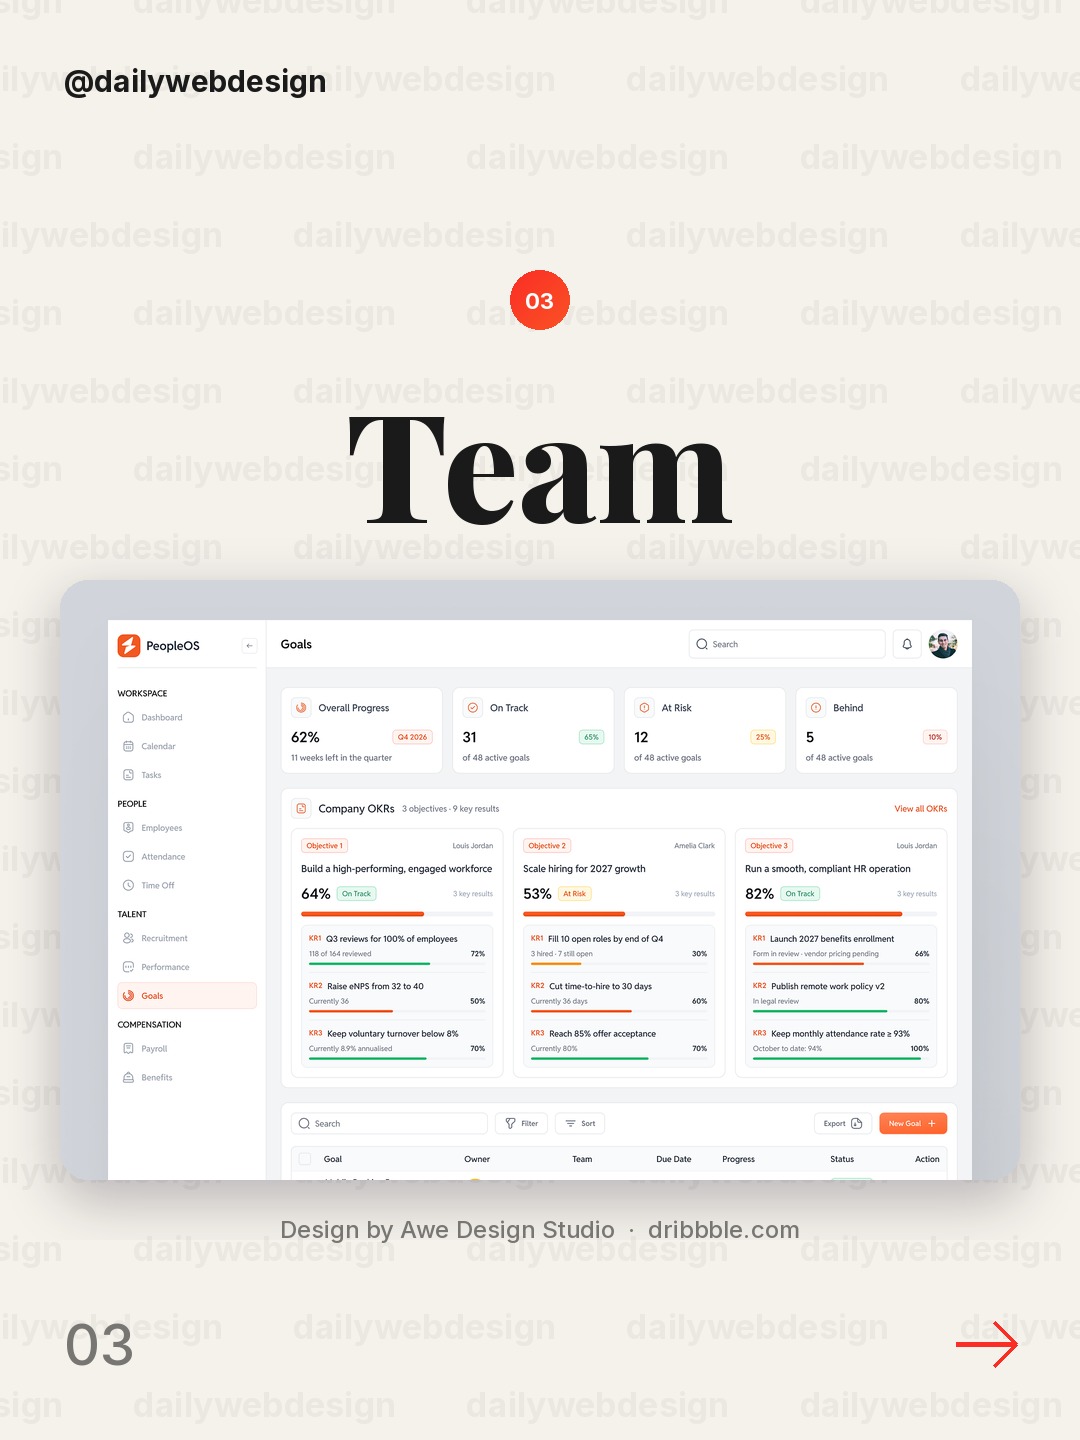
Design by Awe Design Studio, via Dribbble
Team goals work best when progress and ownership sit together. Put the target, current status, and accountable person in one compact view so a team can spot what needs attention.
4. Freelancer Management Dashboard | FLOX by Techwitpro
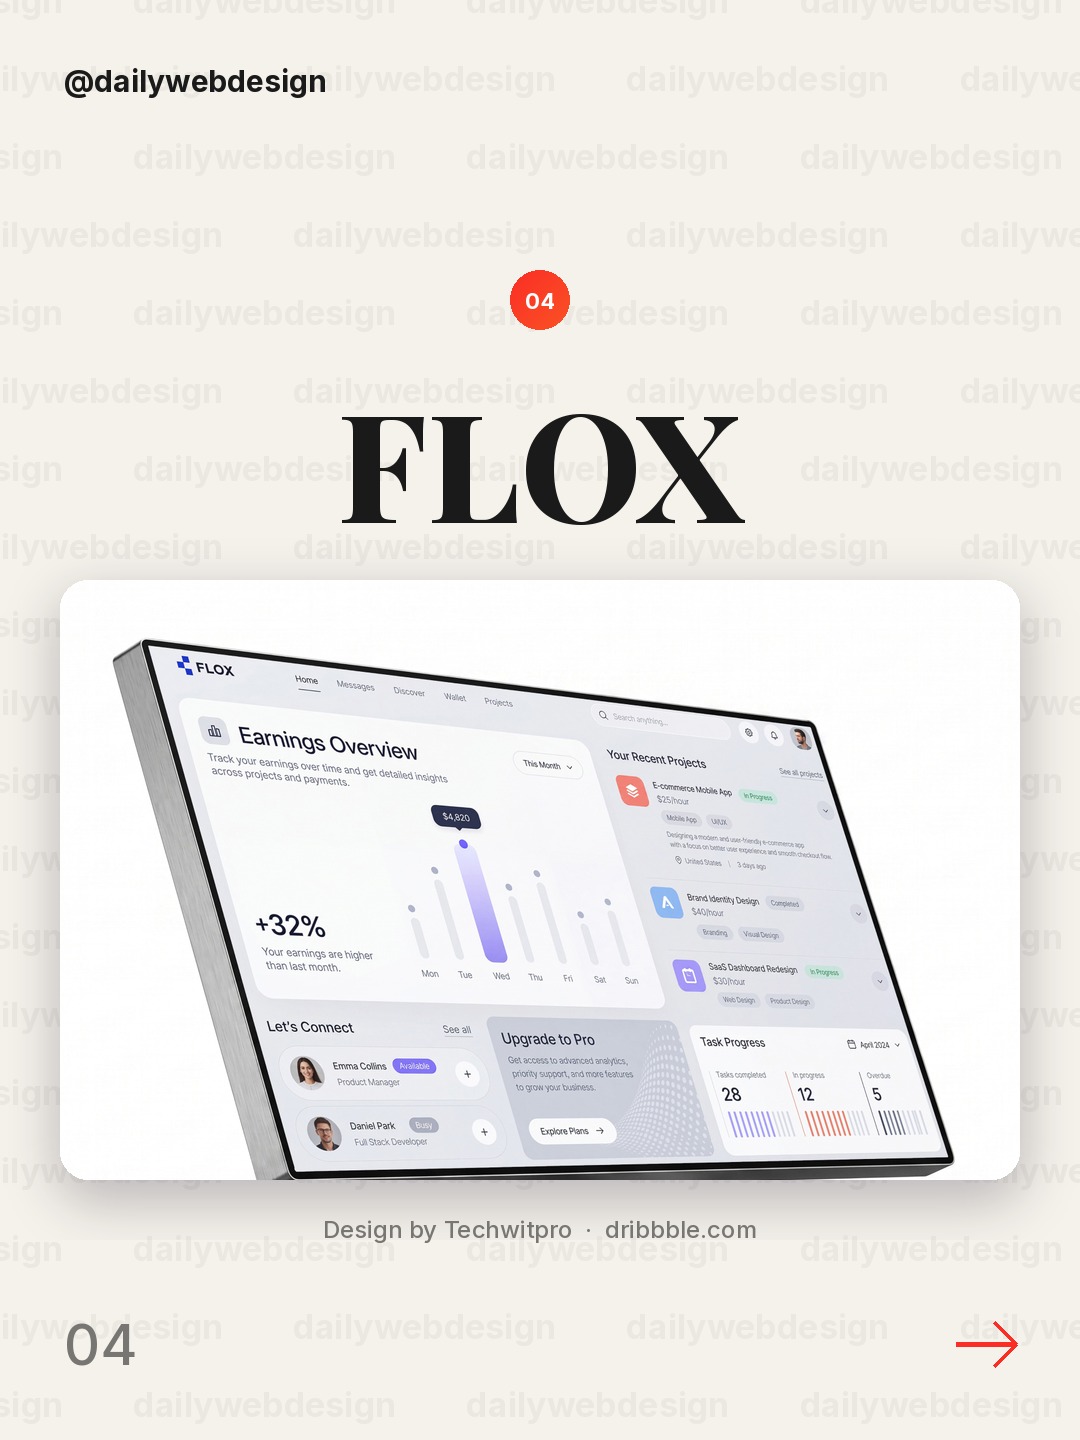
Design by Techwitpro, via Dribbble
A freelancer dashboard has to serve several clients and moving deadlines at once. Separate work by client, then make status and next action visible in the same row to reduce context switching.
5. Cardeva – Heart Health Dashboard UI Design by Orvio - Product Design Agency
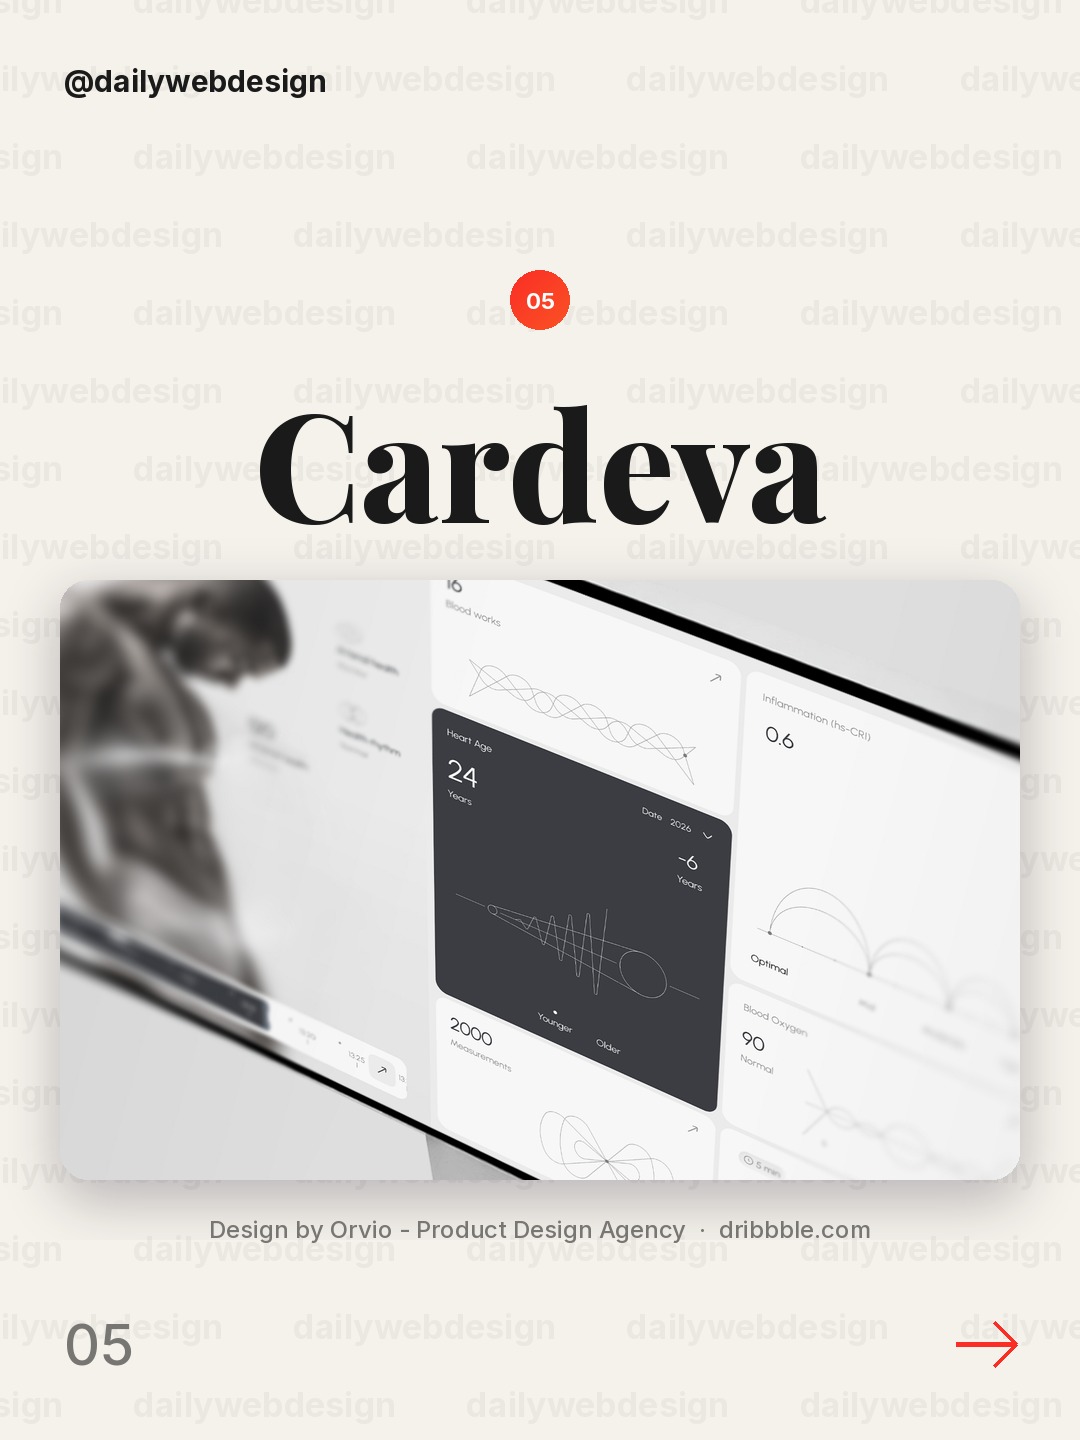
Design by Orvio - Product Design Agency, via Dribbble
In a heart-health interface, prioritize the trend and its time range over decorative charts. Use restrained color for alerts so ordinary readings do not compete with meaningful changes.
6. Crypto Wallet Dashboard UI Design by Conceptzilla
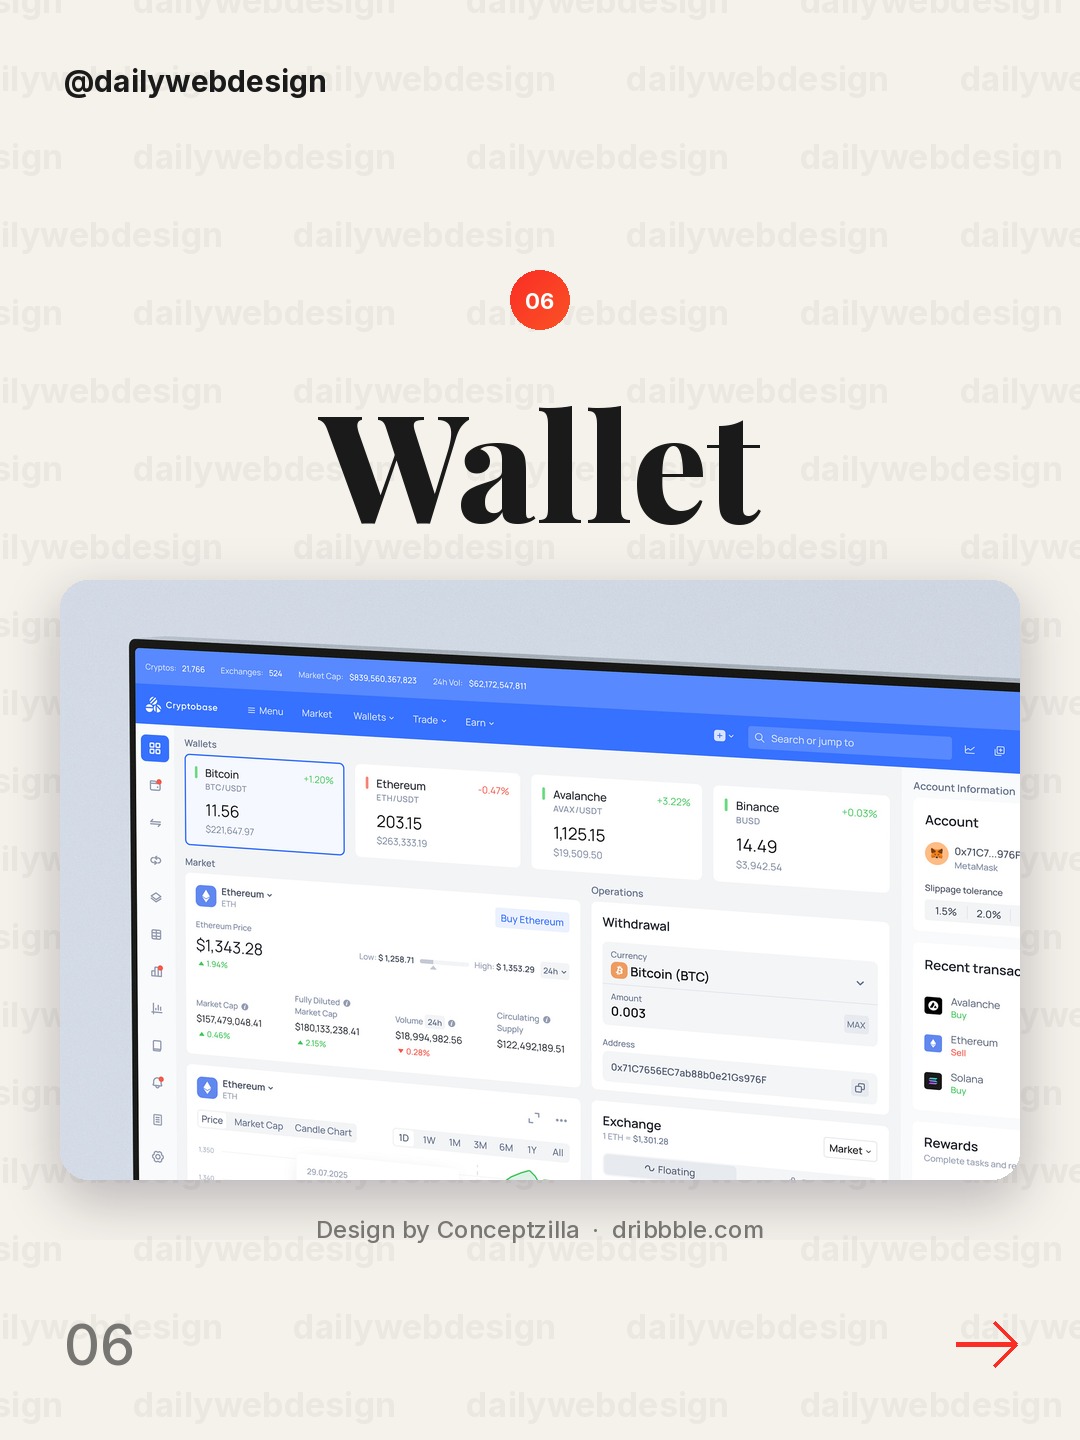
Design by Conceptzilla, via Dribbble
A crypto wallet can show balances and activity without turning every number into an alert. Establish a clear hierarchy between total holdings, asset-level detail, and recent transactions.
7. Halden: Live Fraud Map by Flair
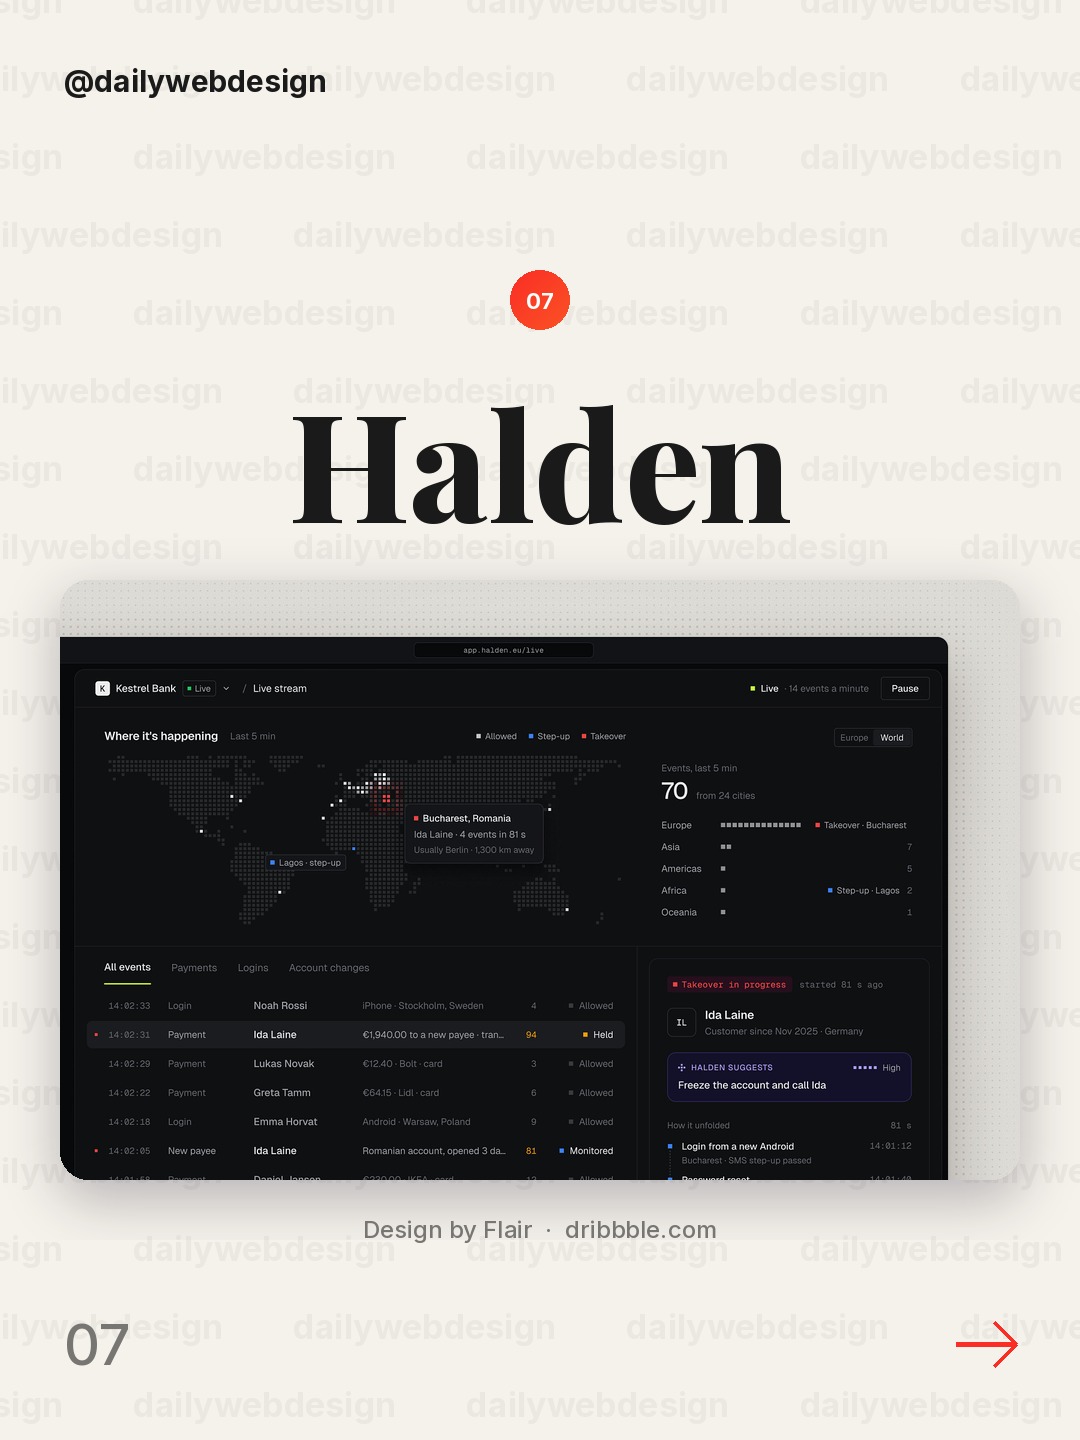
A live fraud map needs geography to support action, not just spectacle. Keep the map paired with a concise queue or status summary so analysts can move from signal to investigation.
8. Nomi Fintech ERP. Transactions Table & Bulk Actions by Dose of Culture
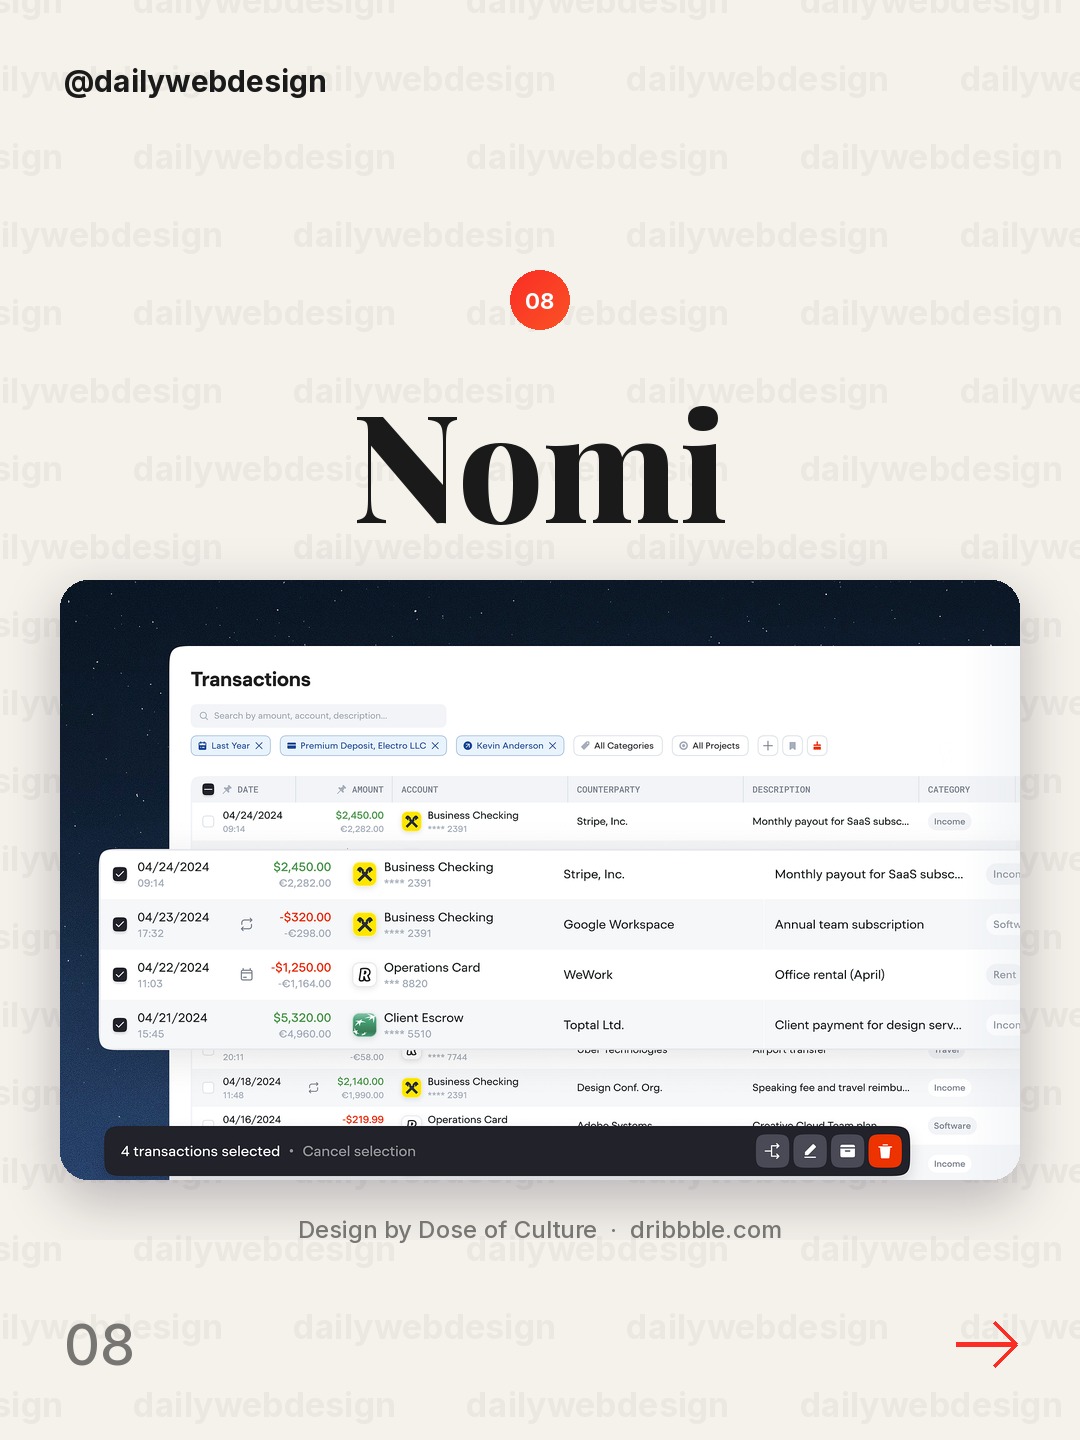
Design by Dose of Culture, via Dribbble
Bulk transaction tools should make selection, scope, and consequences obvious before an action runs. Persistent table headers and visible selection counts help prevent costly mistakes.
9. Account switcher — Untitled UI by Jordan Hughes®
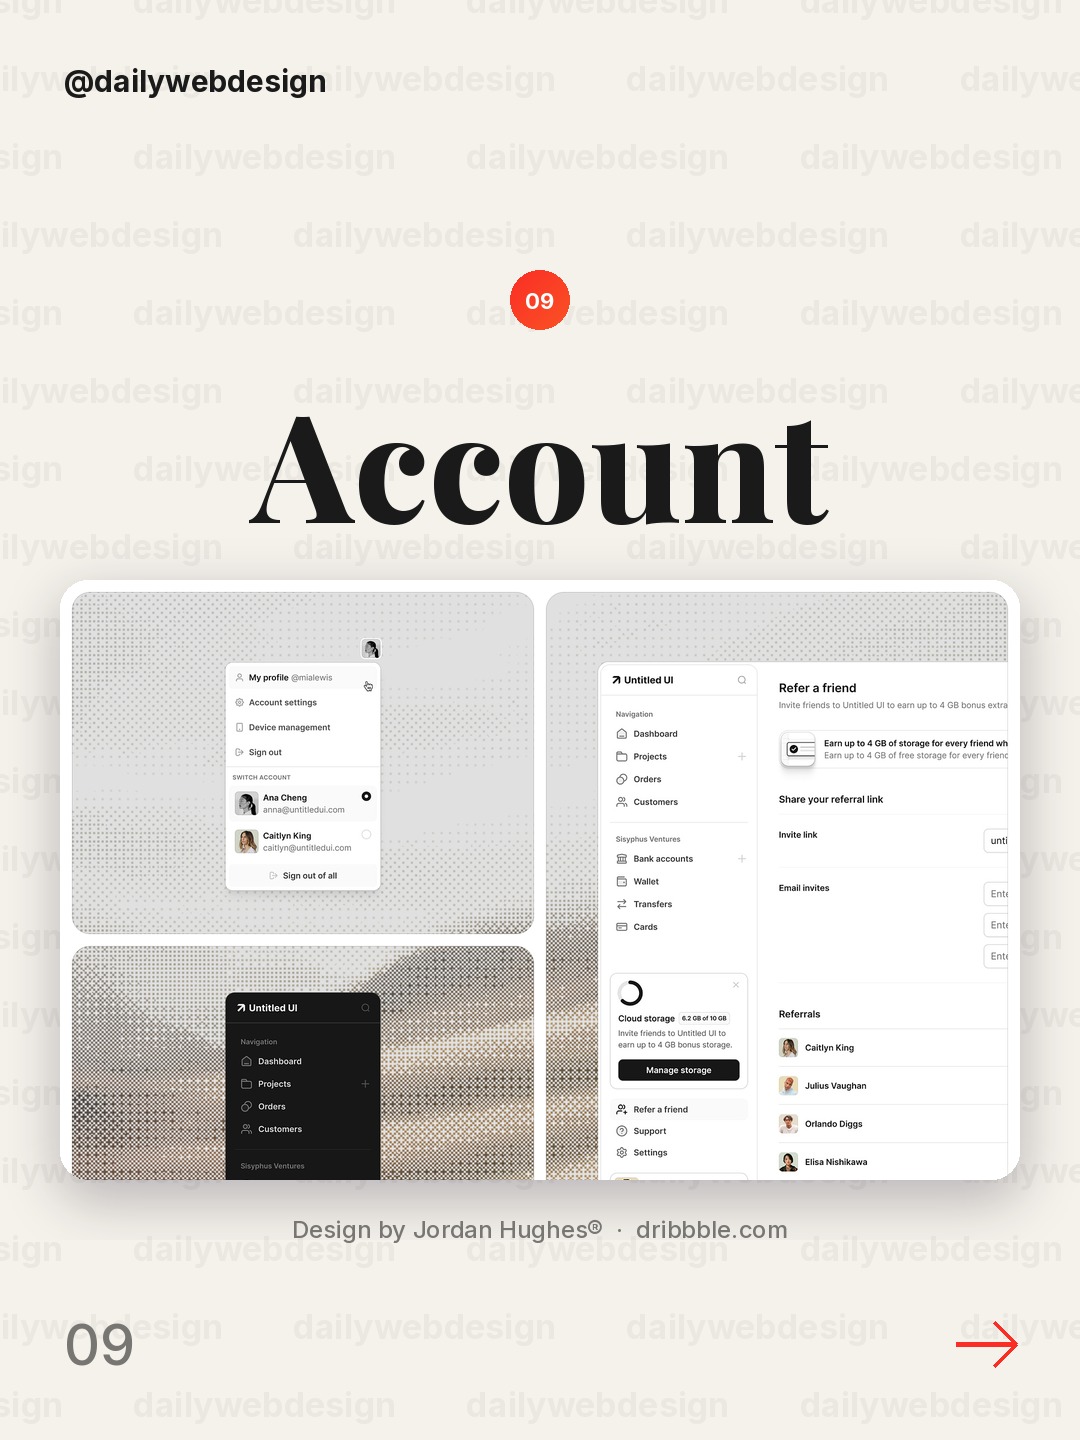
Design by Jordan Hughes®, via Dribbble
An account switcher is a small control with a large impact on orientation. Make the active account unmistakable and keep switching easy to find without letting it dominate the main workspace.
10. SoDEX - Trading Terminal by Vladimir Rakshâ
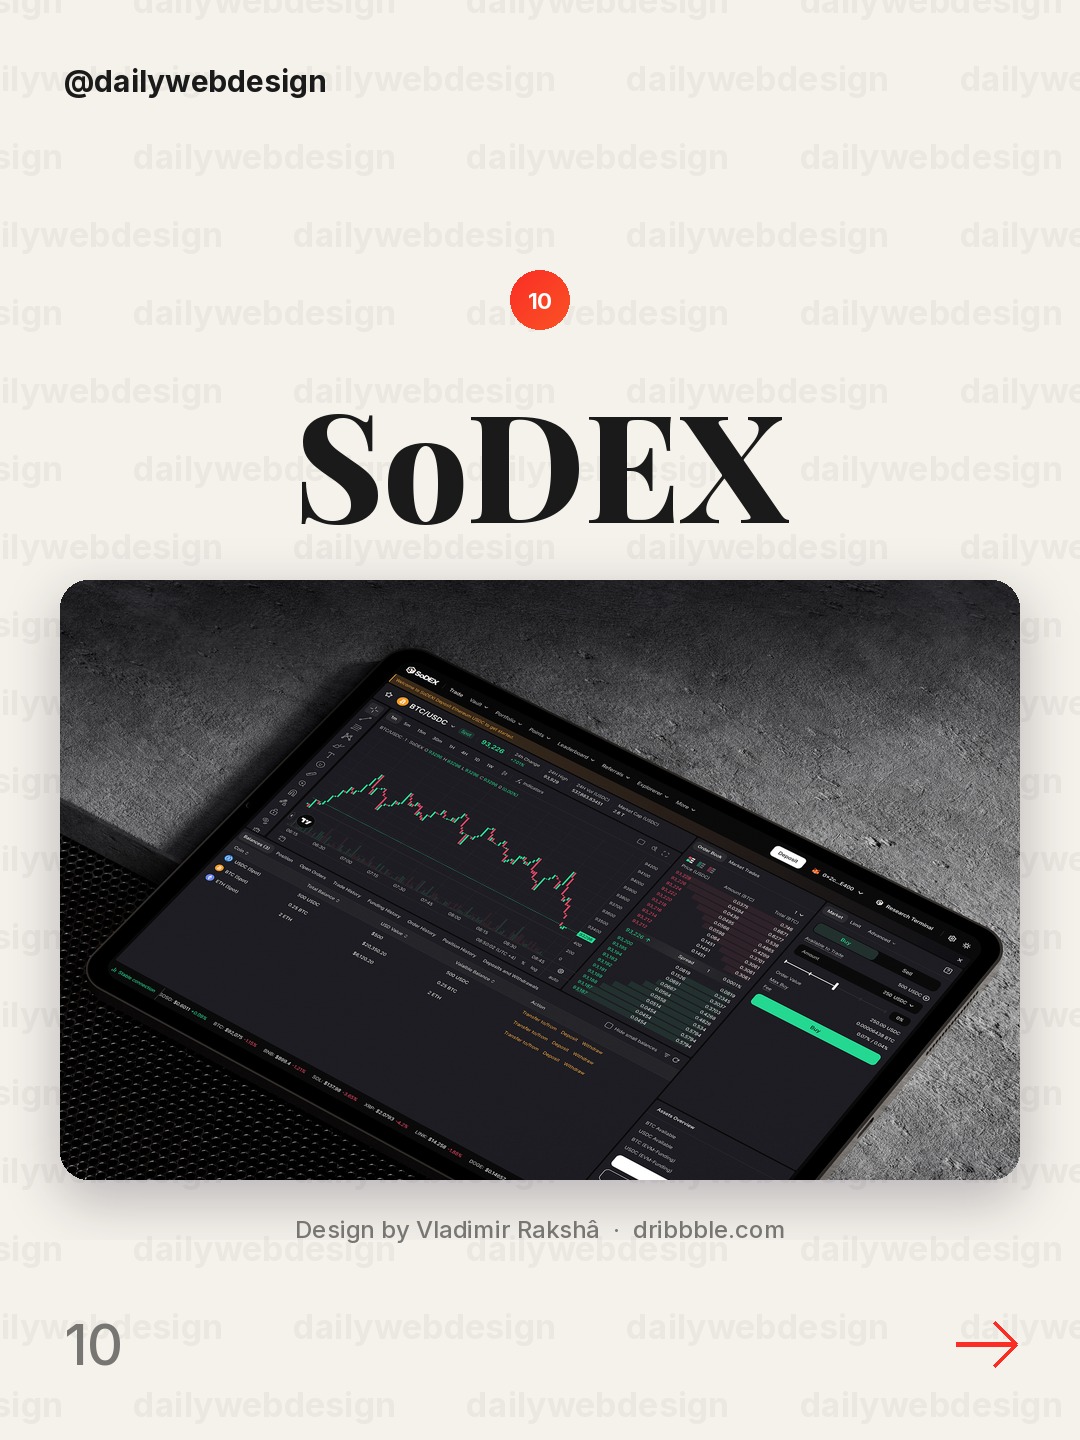
Design by Vladimir Rakshâ, via Dribbble
A trading terminal has to balance speed with legibility. Group related market data and keep the key action area stable so frequent updates do not make the whole interface feel restless.
What I would copy this week
- Put the most important decision metric first, and label its timeframe.
- Pair every status with an owner or a clear next action.
- Use color for meaningful change, not as decoration.
Want to put these ideas to work? Join a NewForm monthly challenge: https://app.newform.community/monthly-challenges
Related on NewForm
Keep reading
Which one is your favorite?
Pick the shot you would save. One vote per visitor.
Personal Wellness Dashboard UI UX Design
Design by PixeleanBittensor Blockchain Explorer — Crypto Analytics Dashboard UI
Design by Demyanchuk Art TeamTeam Goals dashboard PeopleOS
Design by Awe Design StudioFreelancer Management Dashboard | FLOX
Design by TechwitproCardeva – Heart Health Dashboard UI Design
Design by Orvio - Product Design AgencyCrypto Wallet Dashboard UI Design
Design by ConceptzillaHalden: Live Fraud Map
Design by FlairNomi Fintech ERP. Transactions Table & Bulk Actions
Design by Dose of CultureAccount switcher — Untitled UI
Design by Jordan Hughes®SoDEX - Trading Terminal
Design by Vladimir RakshâFind Your Stack
Discover the perfect design tools for your workflow.
Take the 60-second quizNewForm Studio
Turn your designs into professional mockups instantly.
Open StudioMore from NewForm
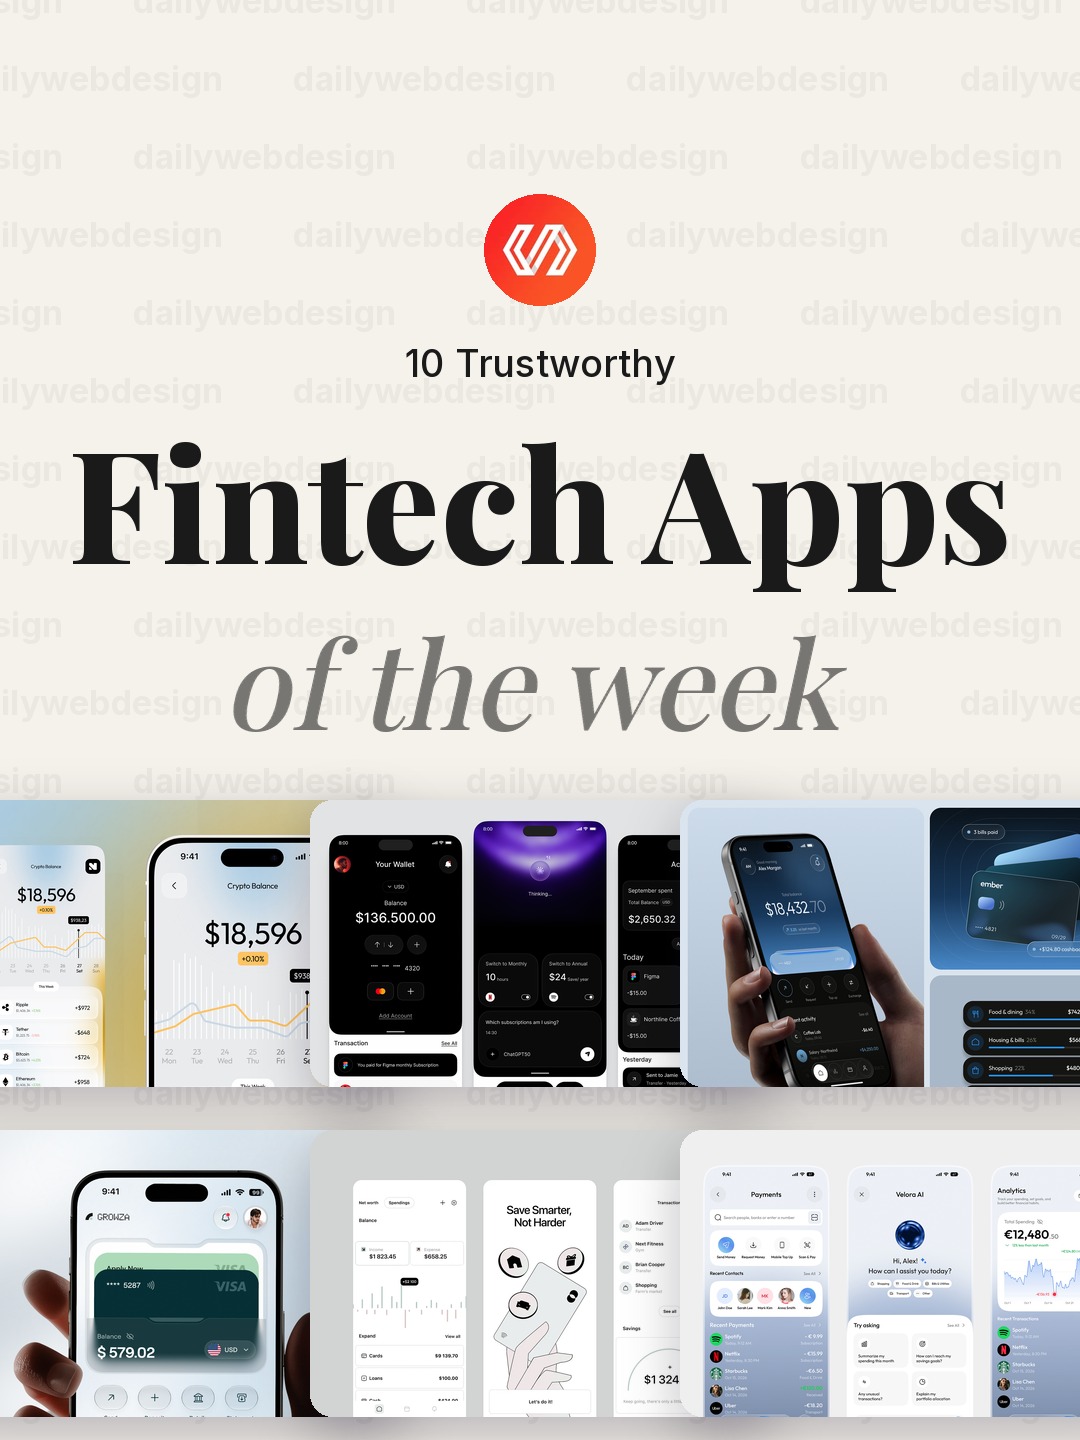
10 Trustworthy Fintech Apps Designs to Learn From (October 2026)
Ten fintech app designs cover banking, payments, personal finance, and investing, with practical interface patterns to borrow. Explore the full collection, designer credits, and cast your vote.
5 min read · Oct 30, 2026
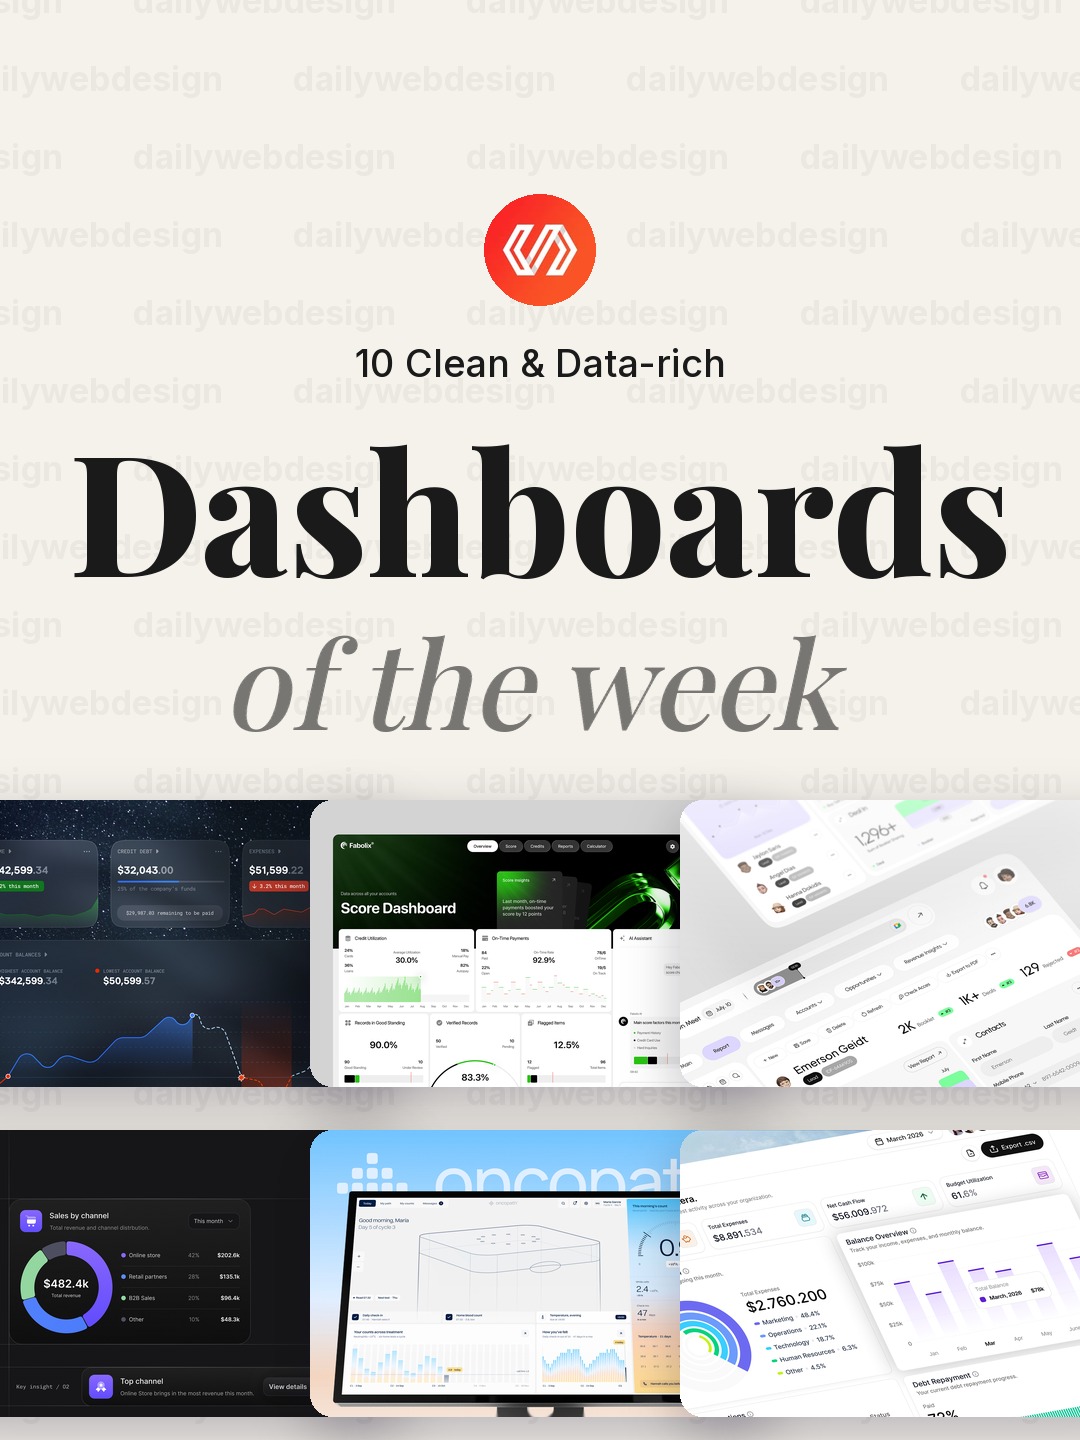
10 Clean Dashboard Designs to Learn From (October 2026)
Ten dashboard designs spanning finance, sales, healthcare, security, and monitoring, with practical interface patterns to borrow. Explore the full collection, designer credits, and cast your vote.
5 min read · Oct 29, 2026