
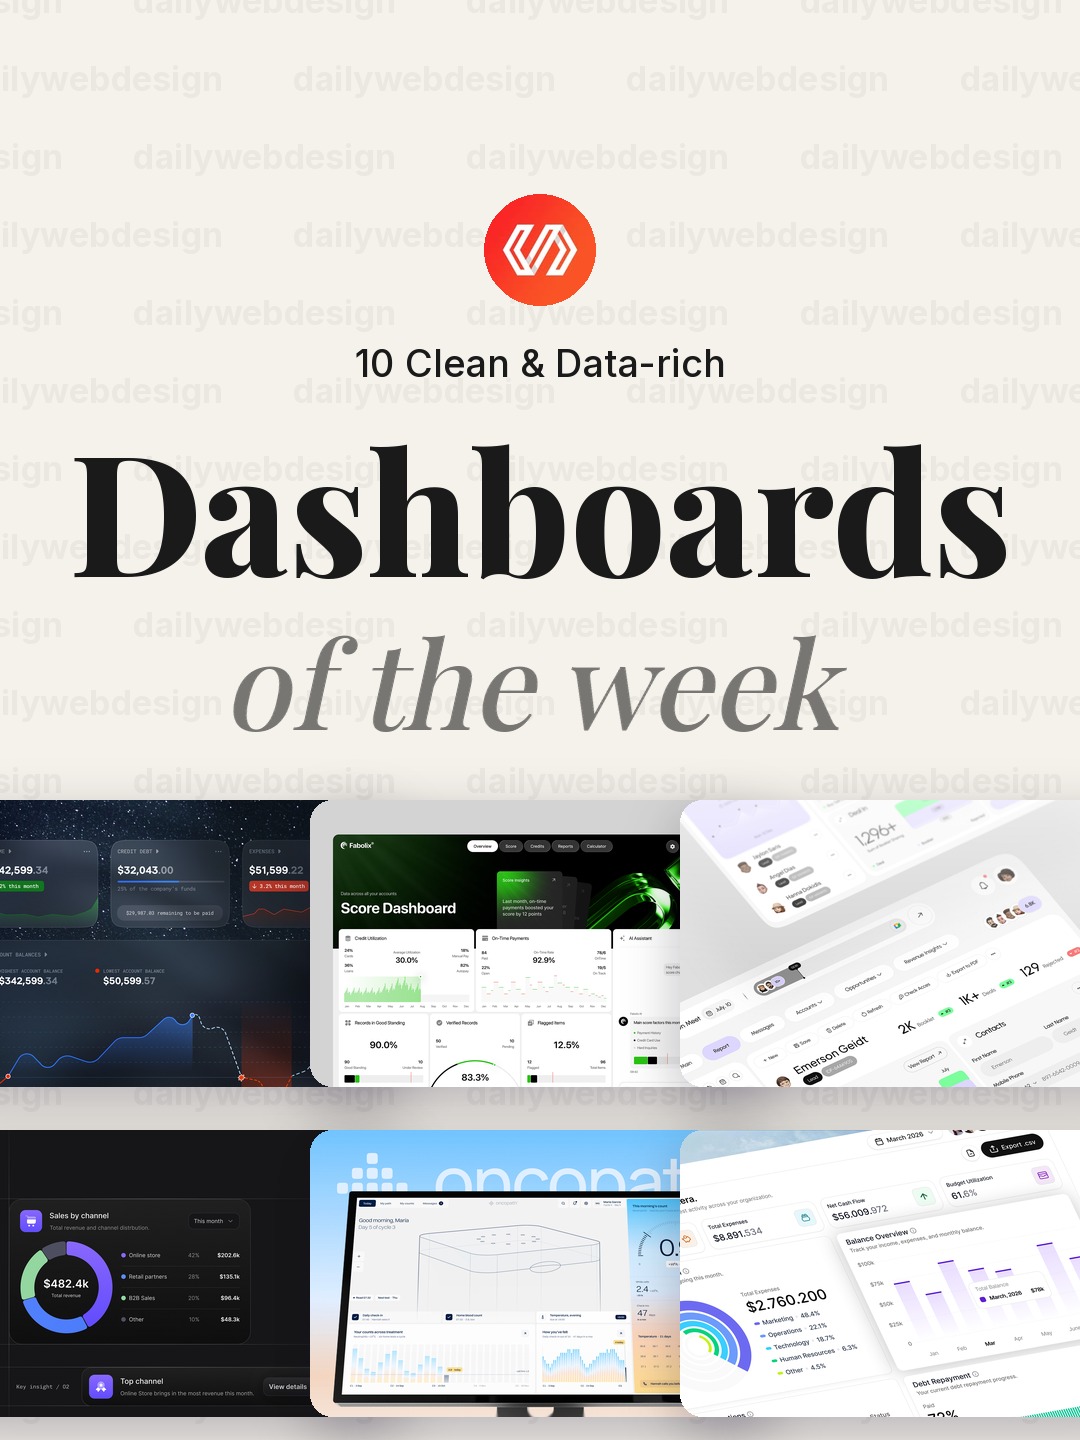
10 Clean Dashboard Designs to Learn From (October 2026)
Dashboards matter because they turn a pile of operational data into a decision someone can make quickly. This week’s Dribbble collection spans finance, healthcare, sales, security, and monitoring, making it a useful study in how different products prioritize the next useful signal.
1. Financial Dashboard UI Design by Dose of Culture
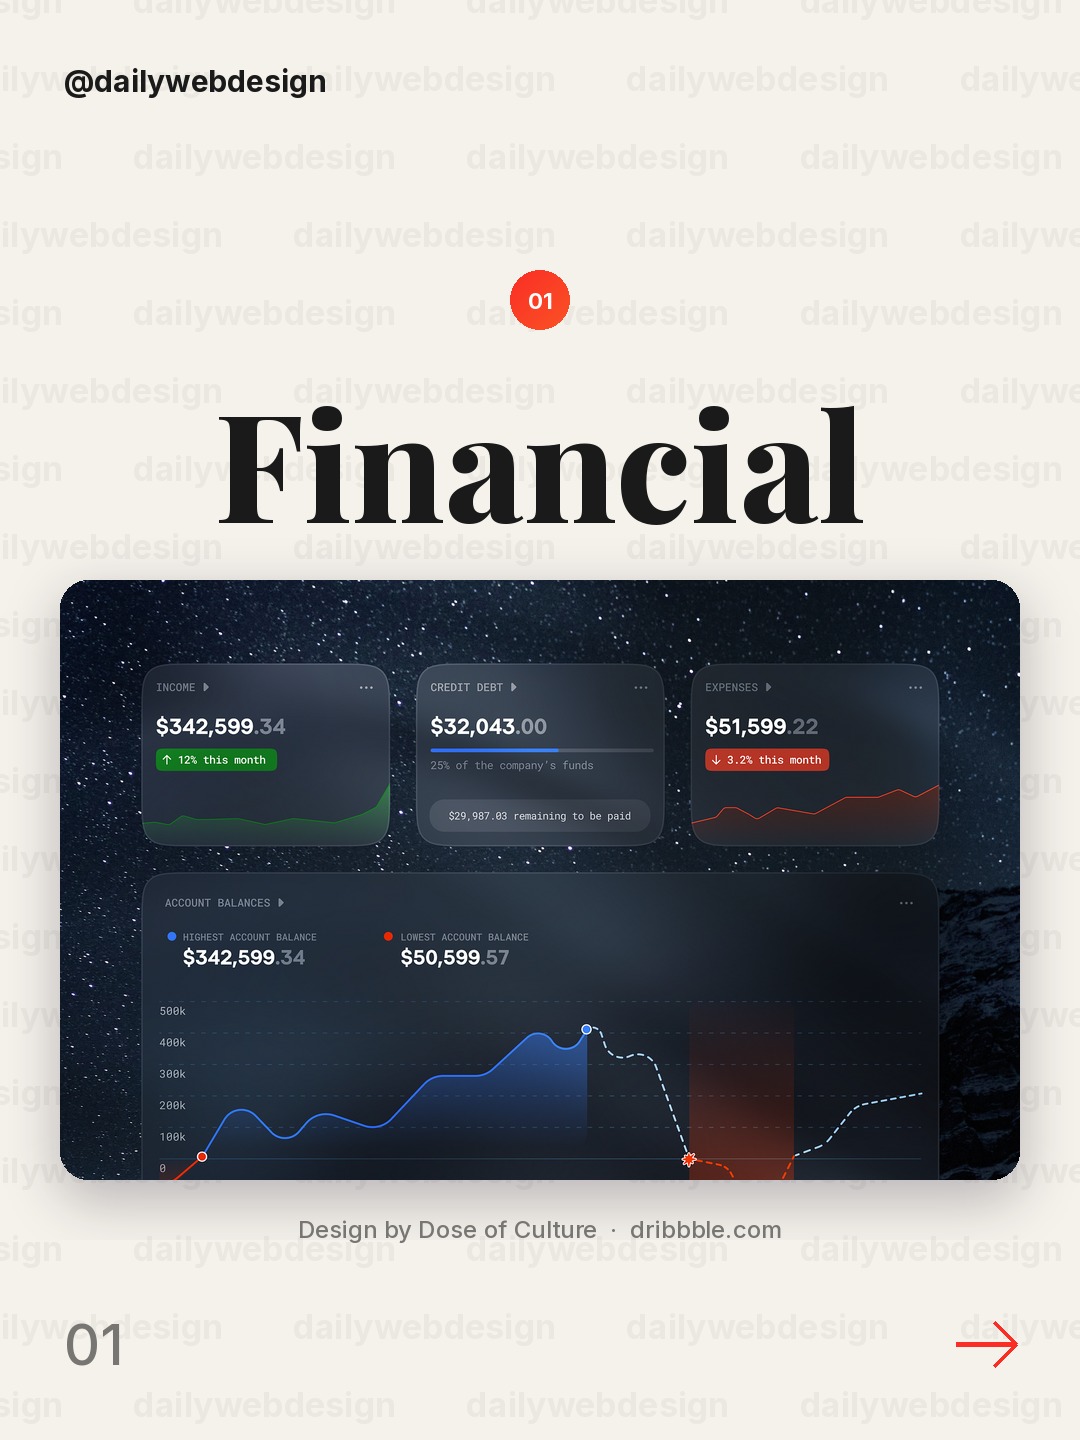
Design by Dose of Culture, via Dribbble
Notice how the financial overview gives key numbers a clear hierarchy before the supporting detail. When borrowing this pattern, keep the balance, cash flow, and trend visible at a glance, then let charts answer the next question.
2. AI-Powered Credit Score Dashboard by Orizon: UI/UX Design Agency
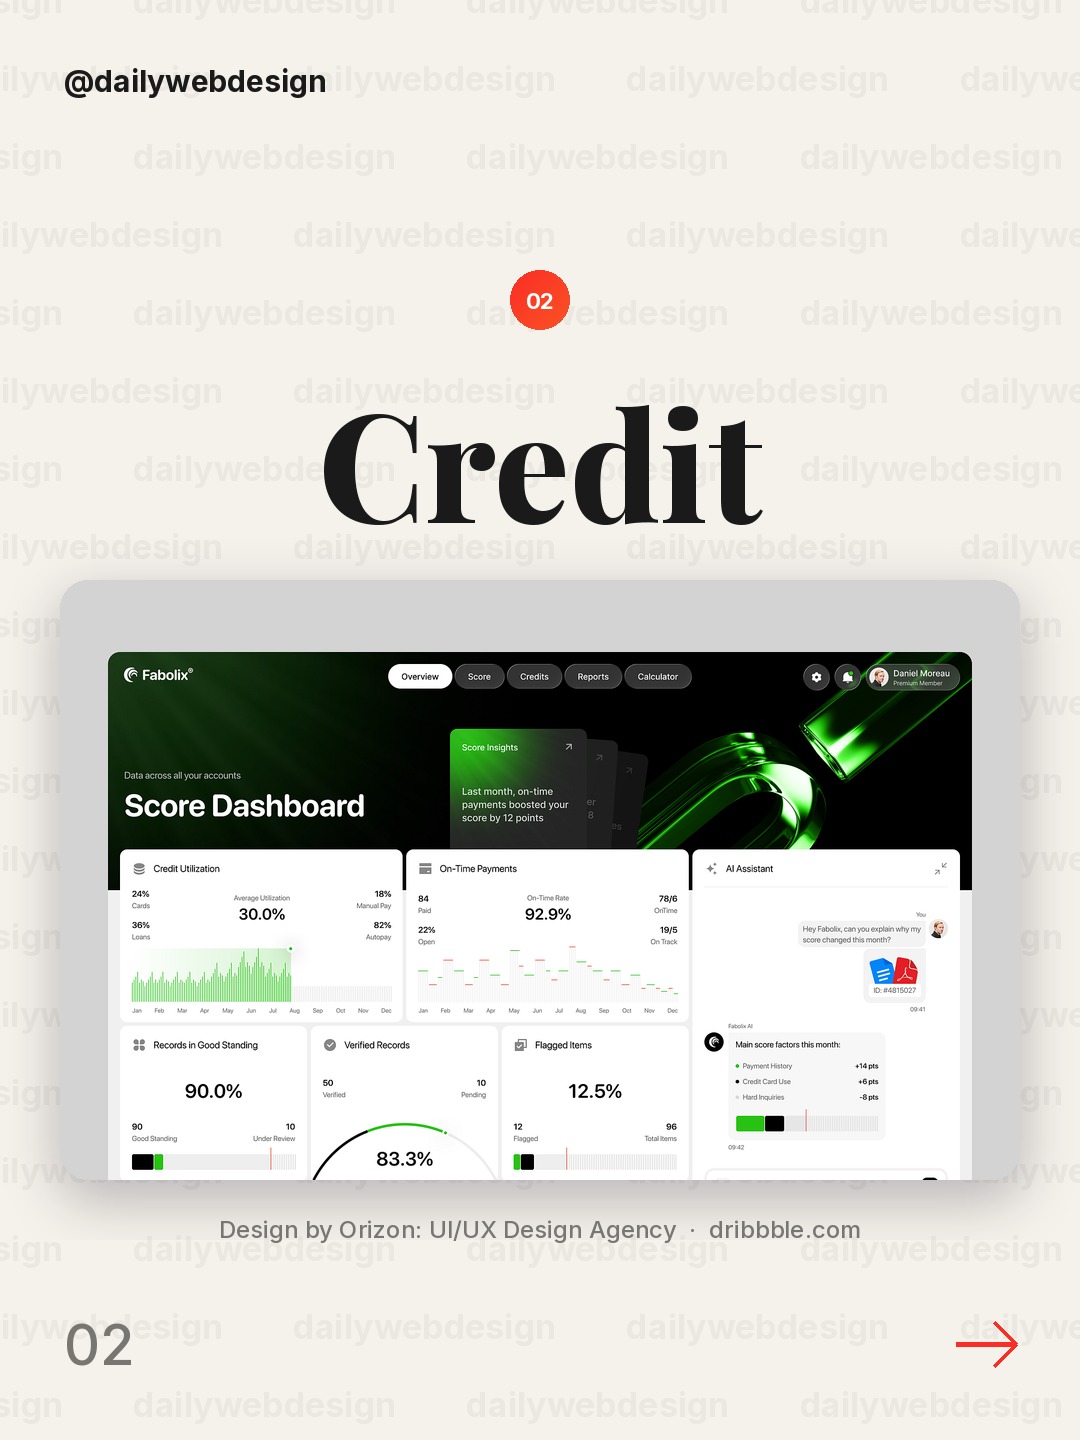
Design by Orizon: UI/UX Design Agency, via Dribbble
The credit-score concept pairs a familiar score with AI guidance. Make the score the anchor, but explain the factors behind it so the interface feels useful rather than mysterious.
3. Sales CRM Dashboard – Property Sales & Lead Management by Hatypo Studio
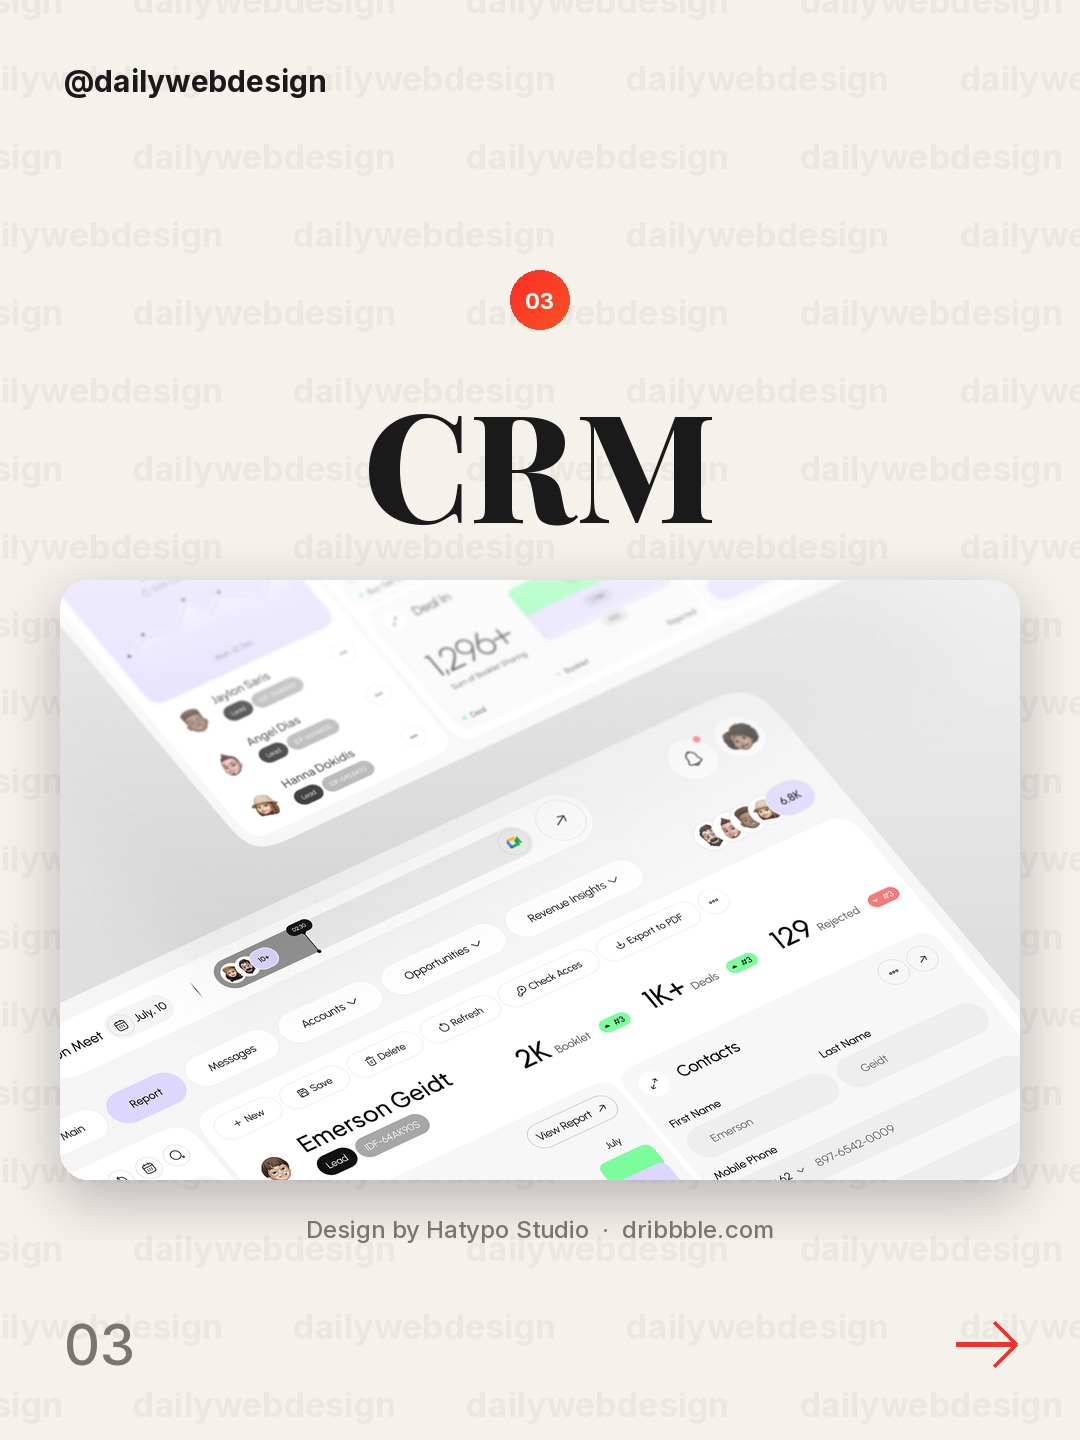
Design by Hatypo Studio, via Dribbble
A property-sales CRM has to serve both pipeline scanning and lead follow-up. Separate stage totals from individual lead actions, and use consistent stage colors so status can be read without opening each record.
4. Sales dashboard UI by Maria M
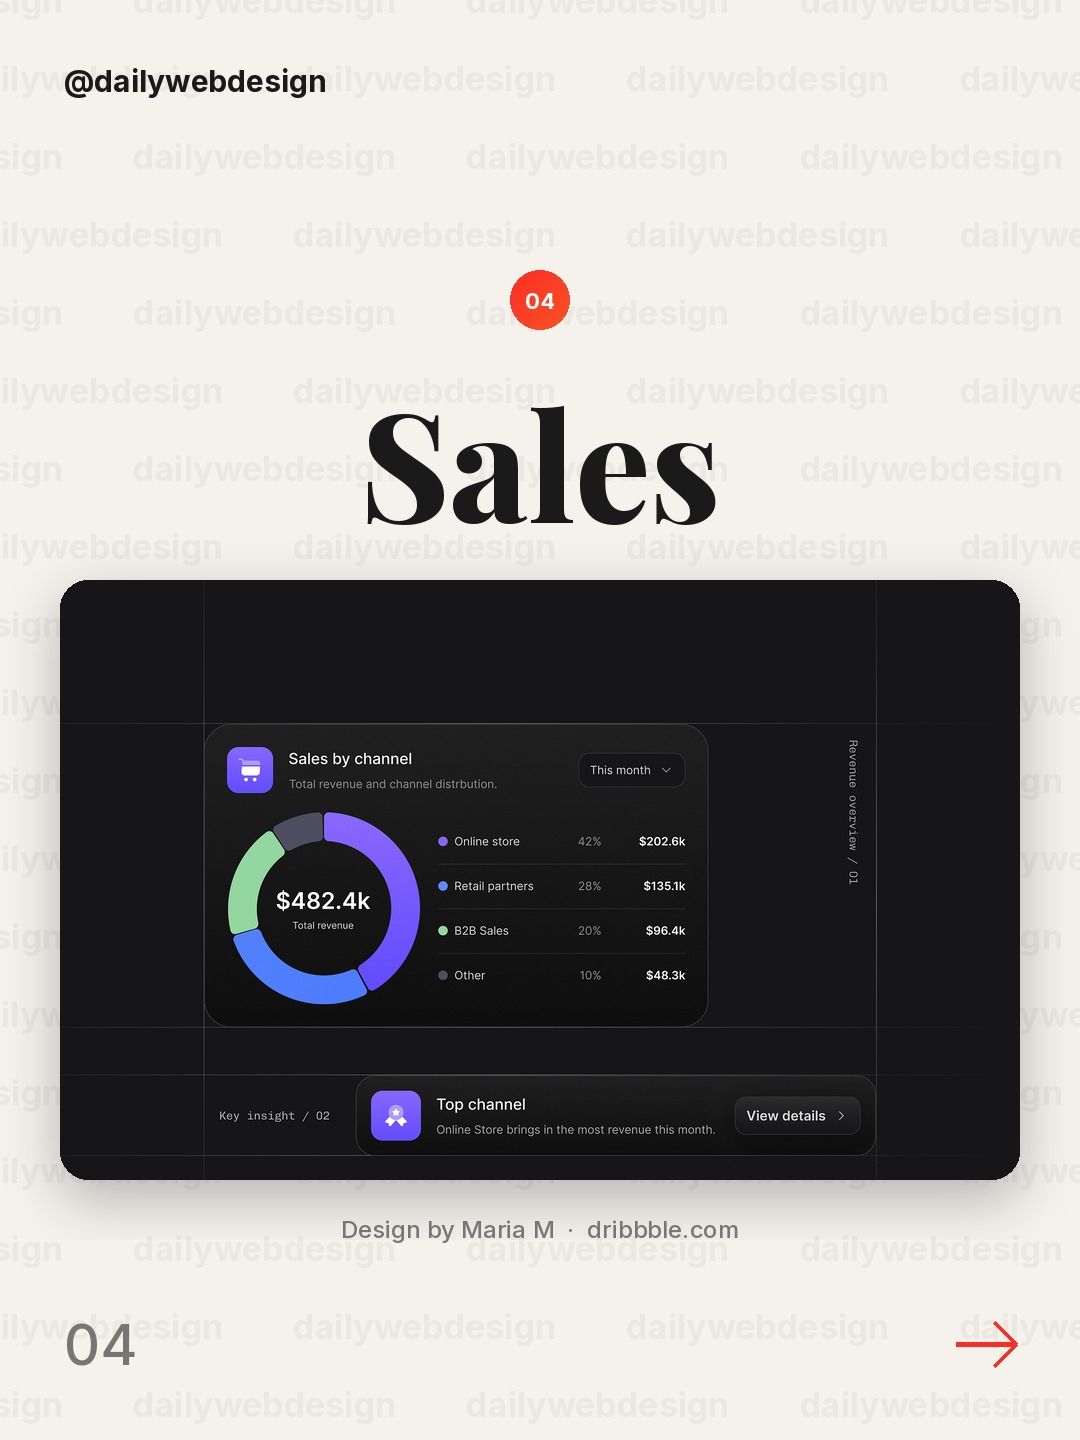
Design by Maria M, via Dribbble
The sales dashboard is a reminder to connect headline performance to the underlying sales activity. Keep the time range and comparison period explicit, and make the next action easy to find.
5. Healthcare Dashboard | UI/UX, Health Tech, Product Design by Dtail Studio
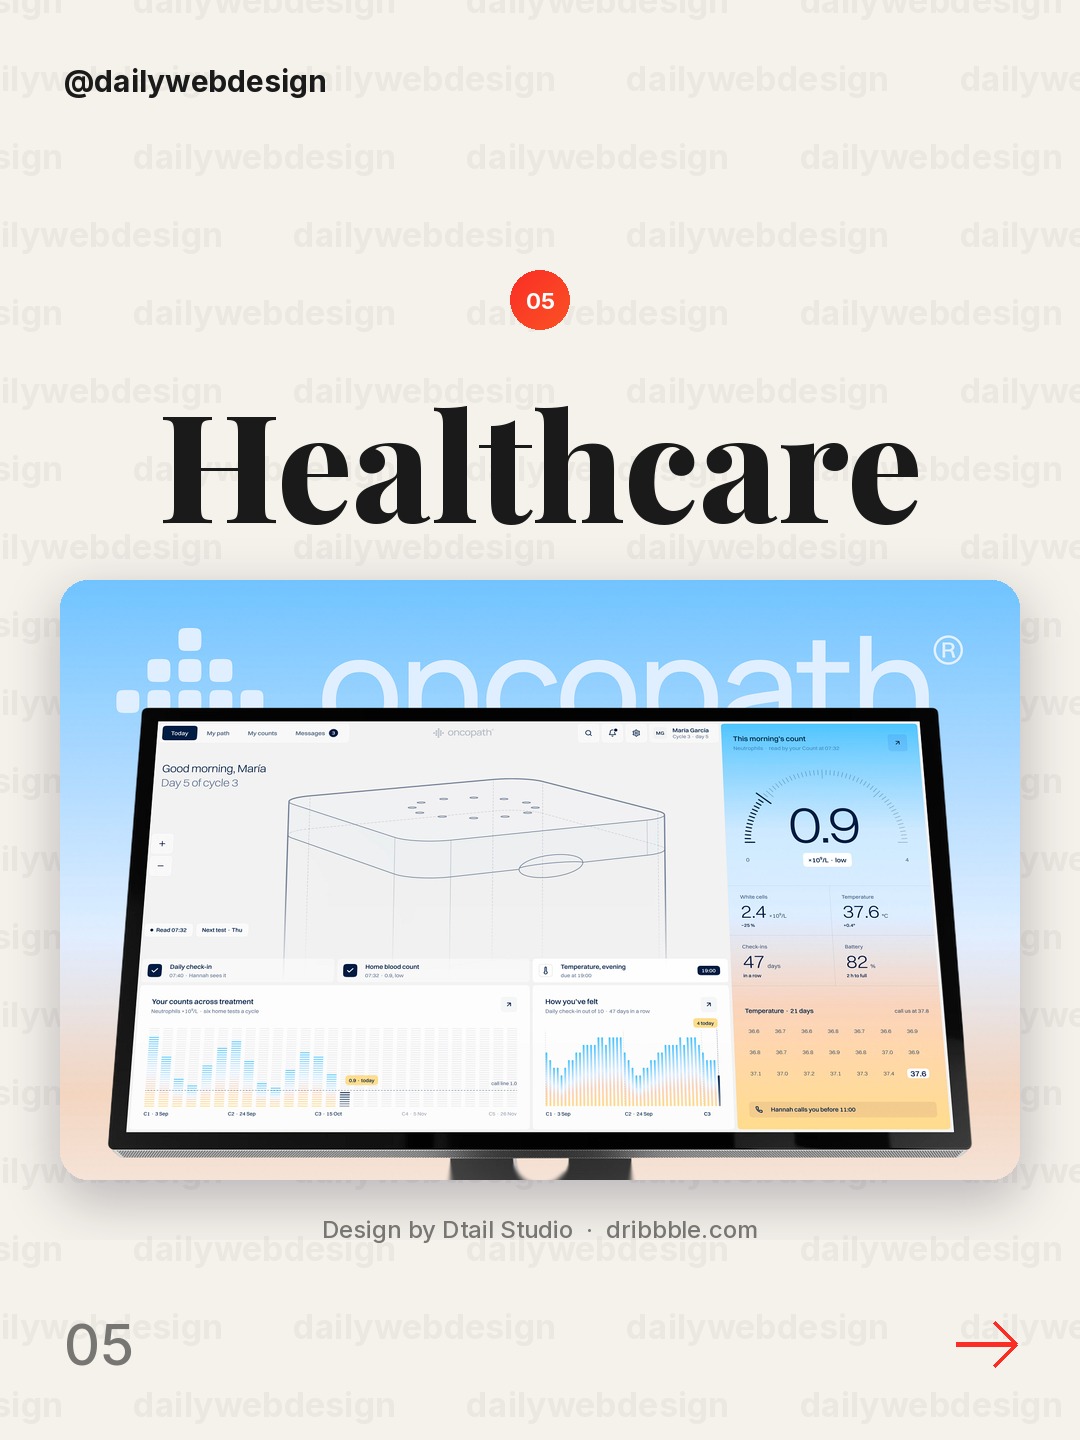
Design by Dtail Studio, via Dribbble
Healthcare dashboards need to make important patient or operational signals easy to spot. Use restrained alert colors, readable labels, and a clear distinction between urgent exceptions and routine measures.
6. Finance Dashboard by Cansaas
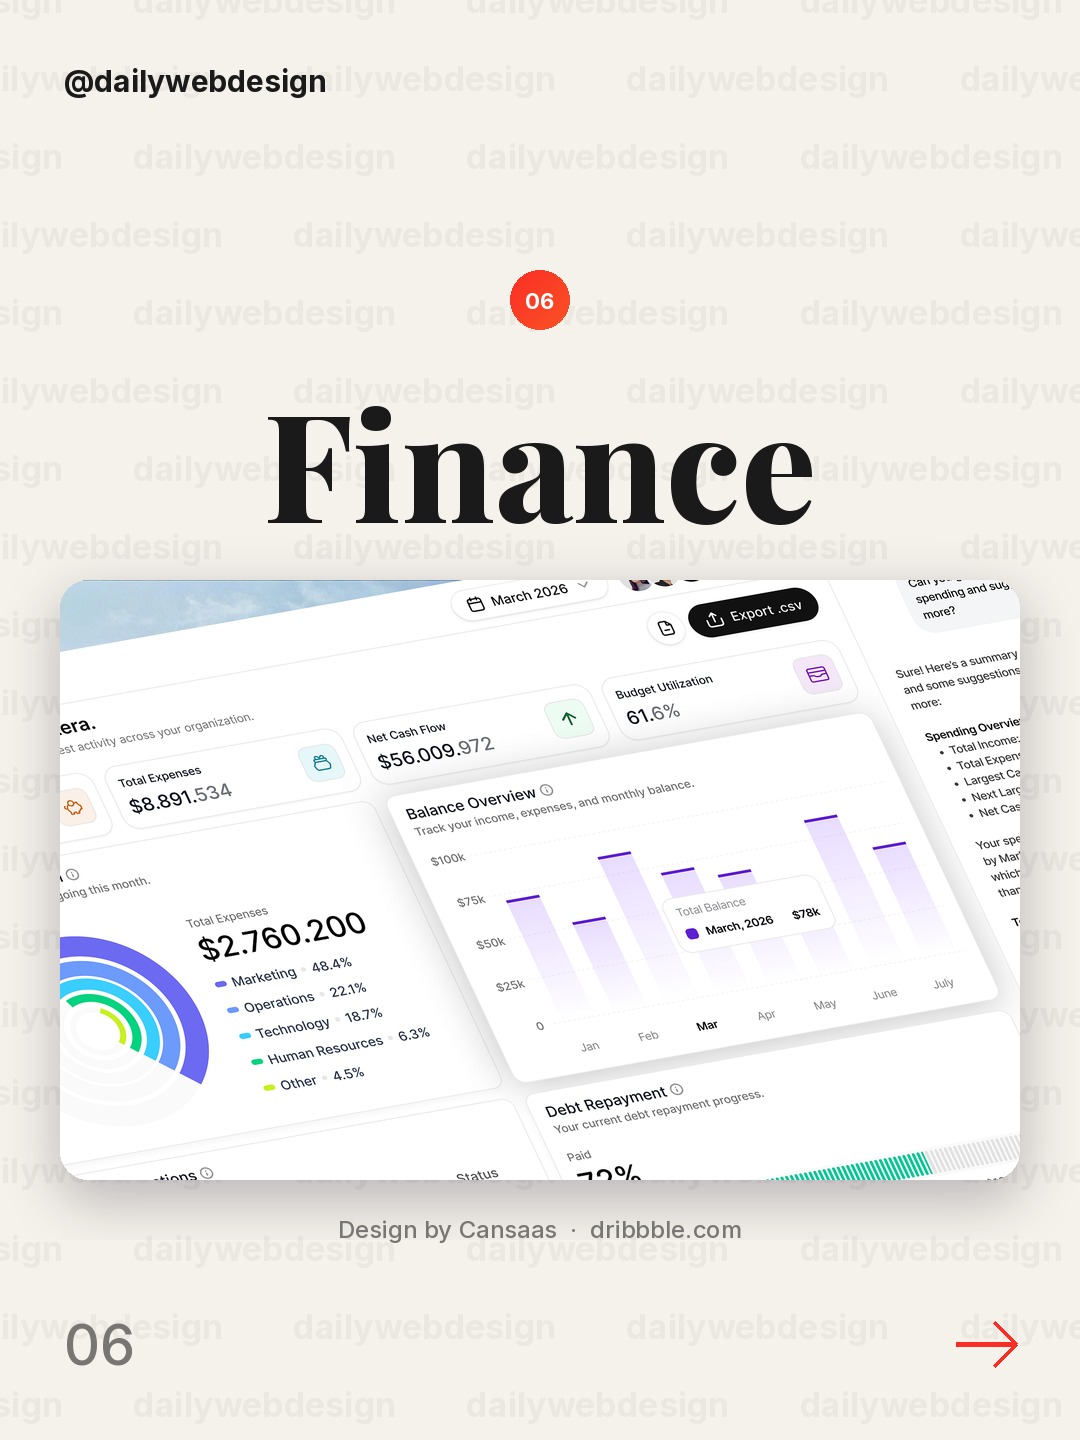
Design by Cansaas, via Dribbble
A finance dashboard works best when balances, changes, and time context are visually connected. Pair each metric with a useful comparison, rather than showing a large number without explaining whether it is moving up or down.
7. Greater - AI Farm Monitoring Dashboard by Dipa Inhouse
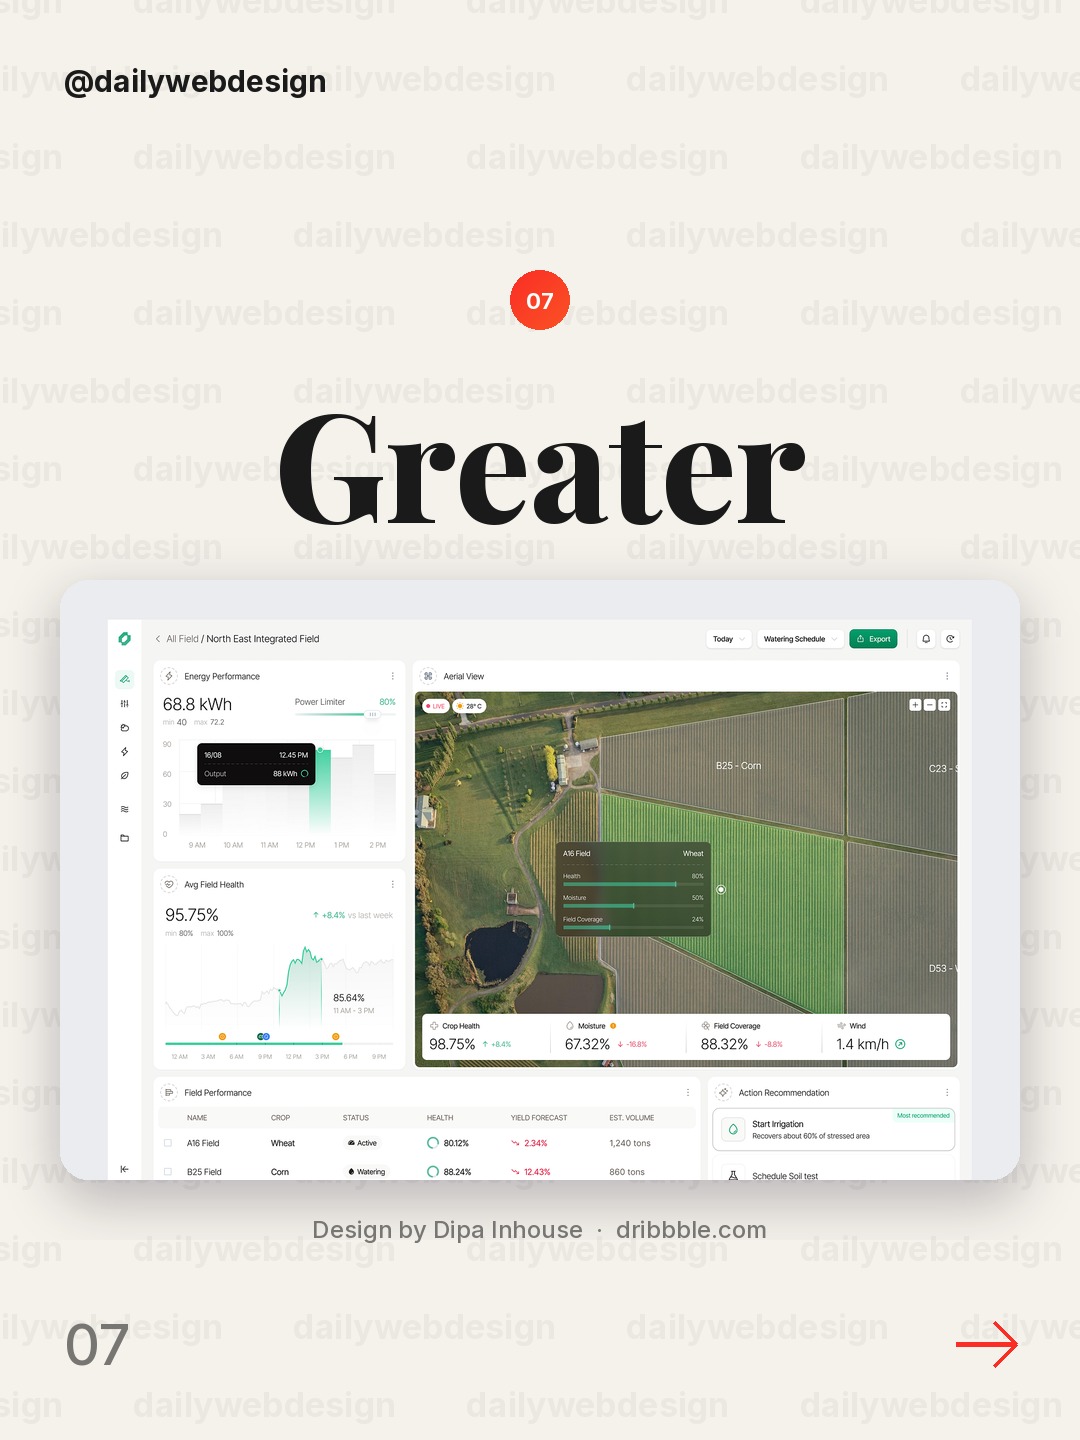
Design by Dipa Inhouse, via Dribbble
Farm monitoring combines a physical operation with AI-assisted observation. Map status to a location or asset, then surface the alert and its evidence together so a user can decide what to inspect next.
8. Vice Bet - GTA Casino by Ribbon Designs Team
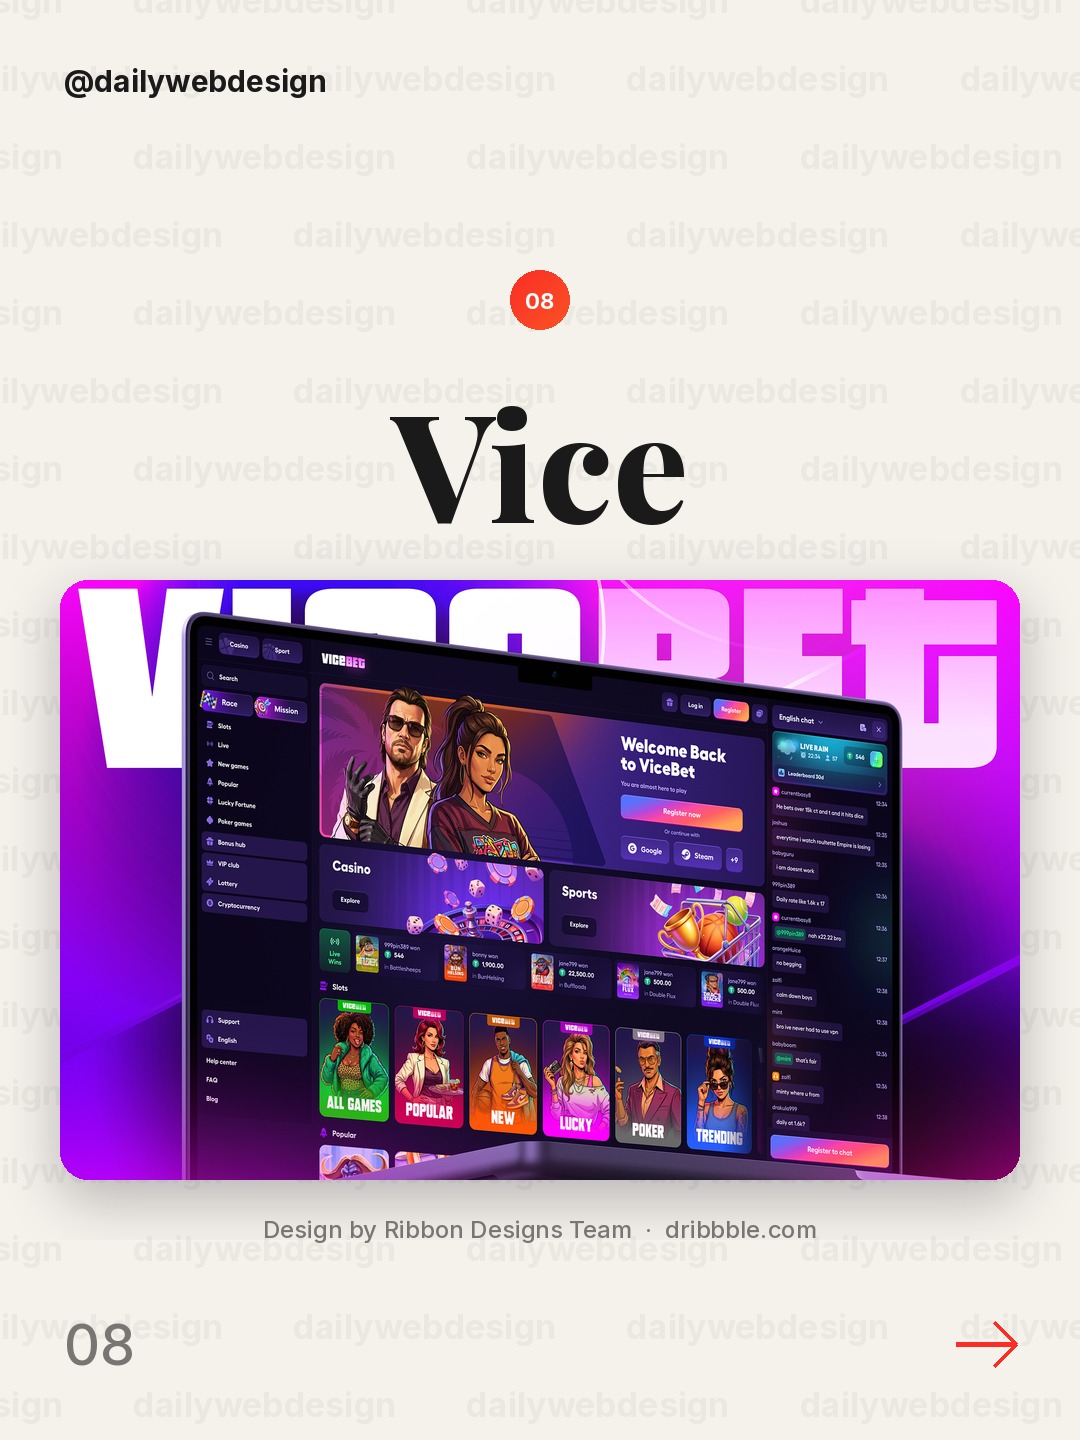
Design by Ribbon Designs Team, via Dribbble
A betting product is a useful reminder that high-energy interfaces still need legibility. Make odds and state changes scannable, and keep action controls visually distinct from promotional elements.
9. Deadband: cybersecurity threat monitoring by heartbeat
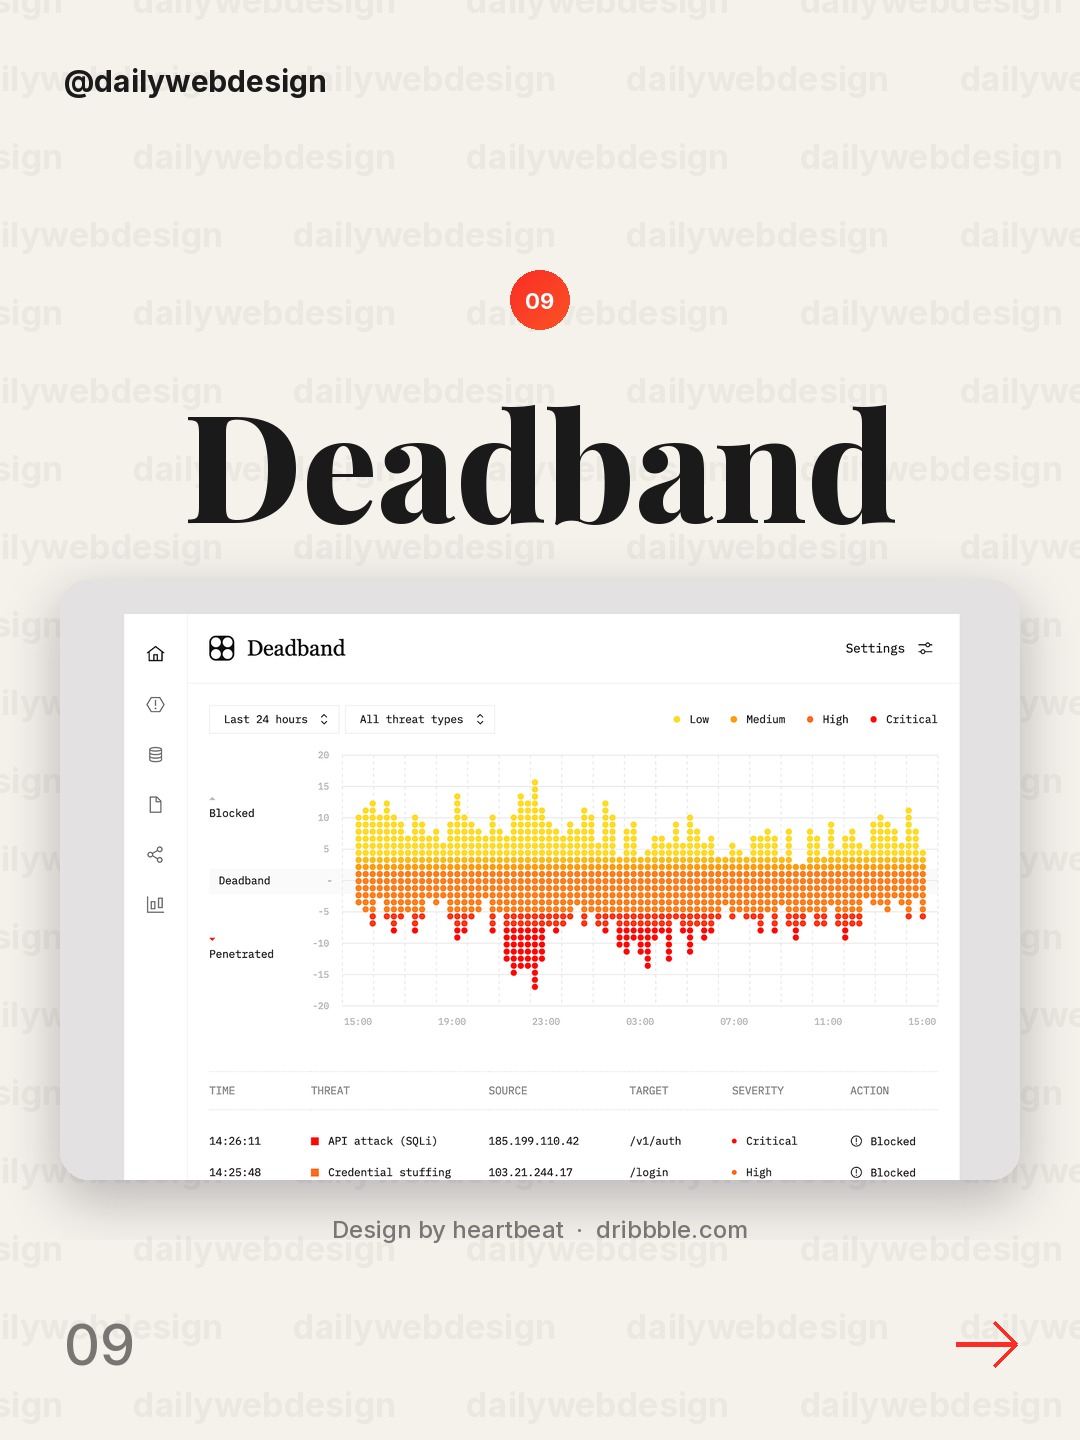
Design by heartbeat, via Dribbble
Cybersecurity monitoring must make threats and response state legible under pressure. Group alerts by severity, show what changed and when, and give analysts a clear route from signal to investigation.
10. Table layouts — Untitled UI by Jordan Hughes®
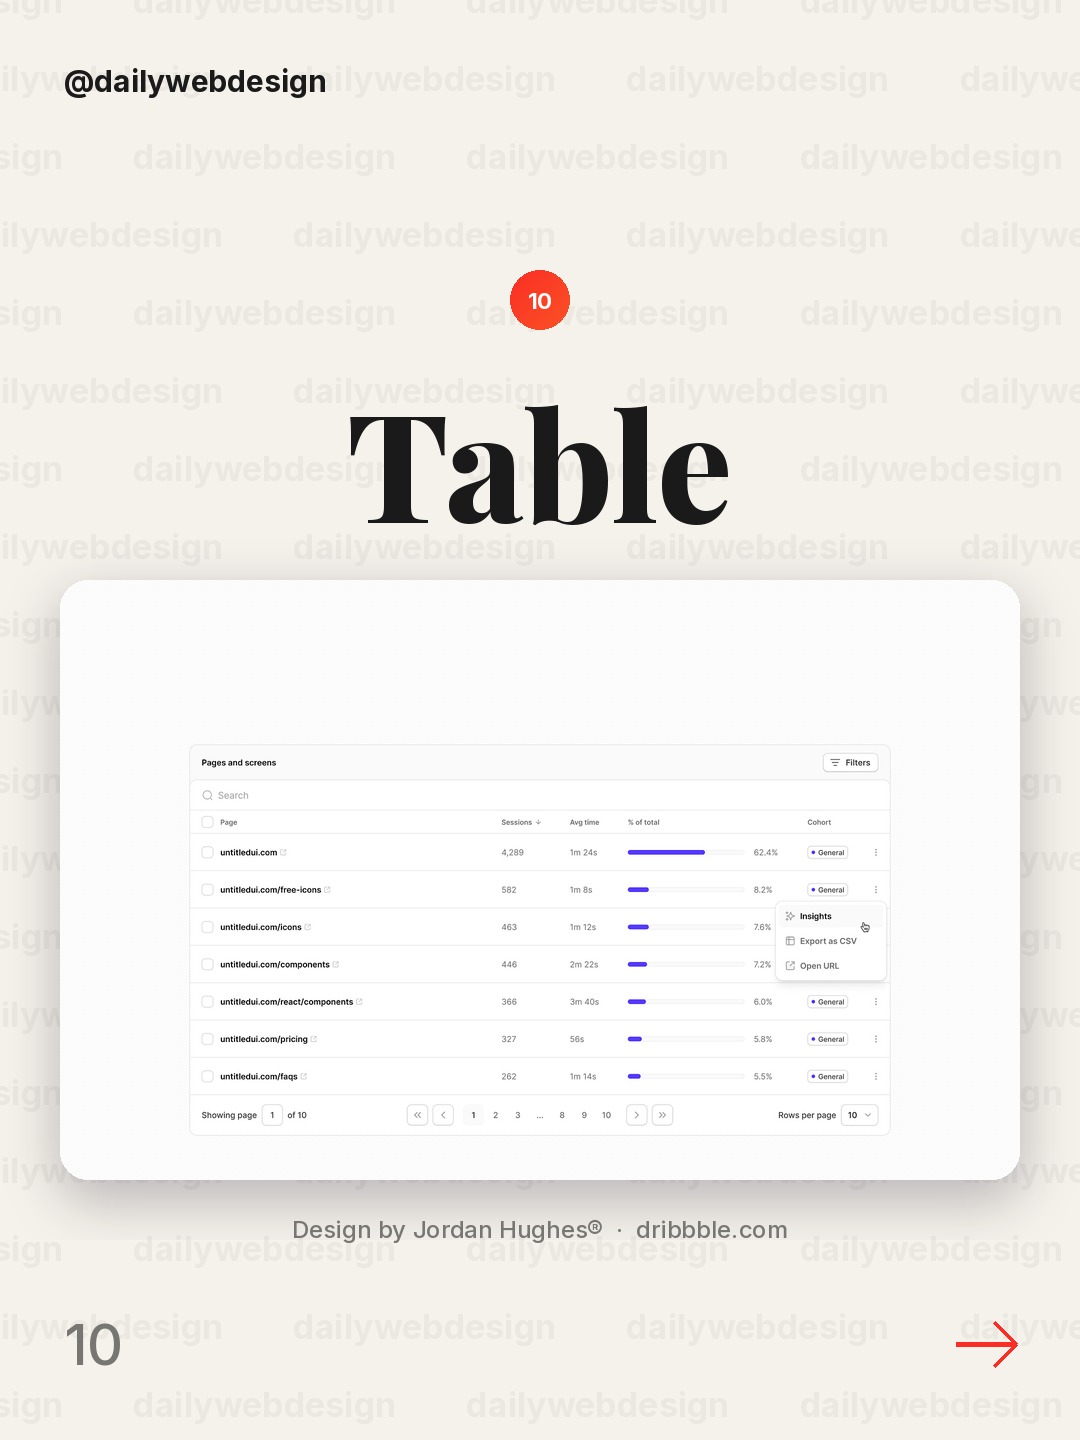
Design by Jordan Hughes®, via Dribbble
Table-heavy products can feel calm when alignment and spacing do the work. Keep numeric columns consistent, use restrained row separators, and make sorting or selection states obvious.
What I would copy this week
- Put one primary decision metric at the top, with its comparison period beside it.
- Use color for meaning, especially status and exceptions, not decoration.
- Make a chart or table lead naturally to the next action, without hiding the underlying detail.
Want to put these ideas into practice? Explore the NewForm monthly challenges.
Related on NewForm
Keep reading
Which one is your favorite?
Pick the shot you would save. One vote per visitor.
Financial Dashboard UI Design
Design by Dose of CultureAI-Powered Credit Score Dashboard
Design by Orizon: UI/UX Design AgencySales CRM Dashboard – Property Sales & Lead Management
Design by Hatypo StudioSales dashboard UI
Design by Maria MHealthcare Dashboard | UI/UX, Health Tech, Product Design
Design by Dtail StudioFinance Dashboard
Design by CansaasGreater - AI Farm Monitoring Dashboard
Design by Dipa InhouseVice Bet - GTA Casino
Design by Ribbon Designs TeamDeadband: cybersecurity threat monitoring
Design by heartbeatTable layouts — Untitled UI
Design by Jordan Hughes®Find Your Stack
Discover the perfect design tools for your workflow.
Take the 60-second quizNewForm Studio
Turn your designs into professional mockups instantly.
Open StudioMore from NewForm
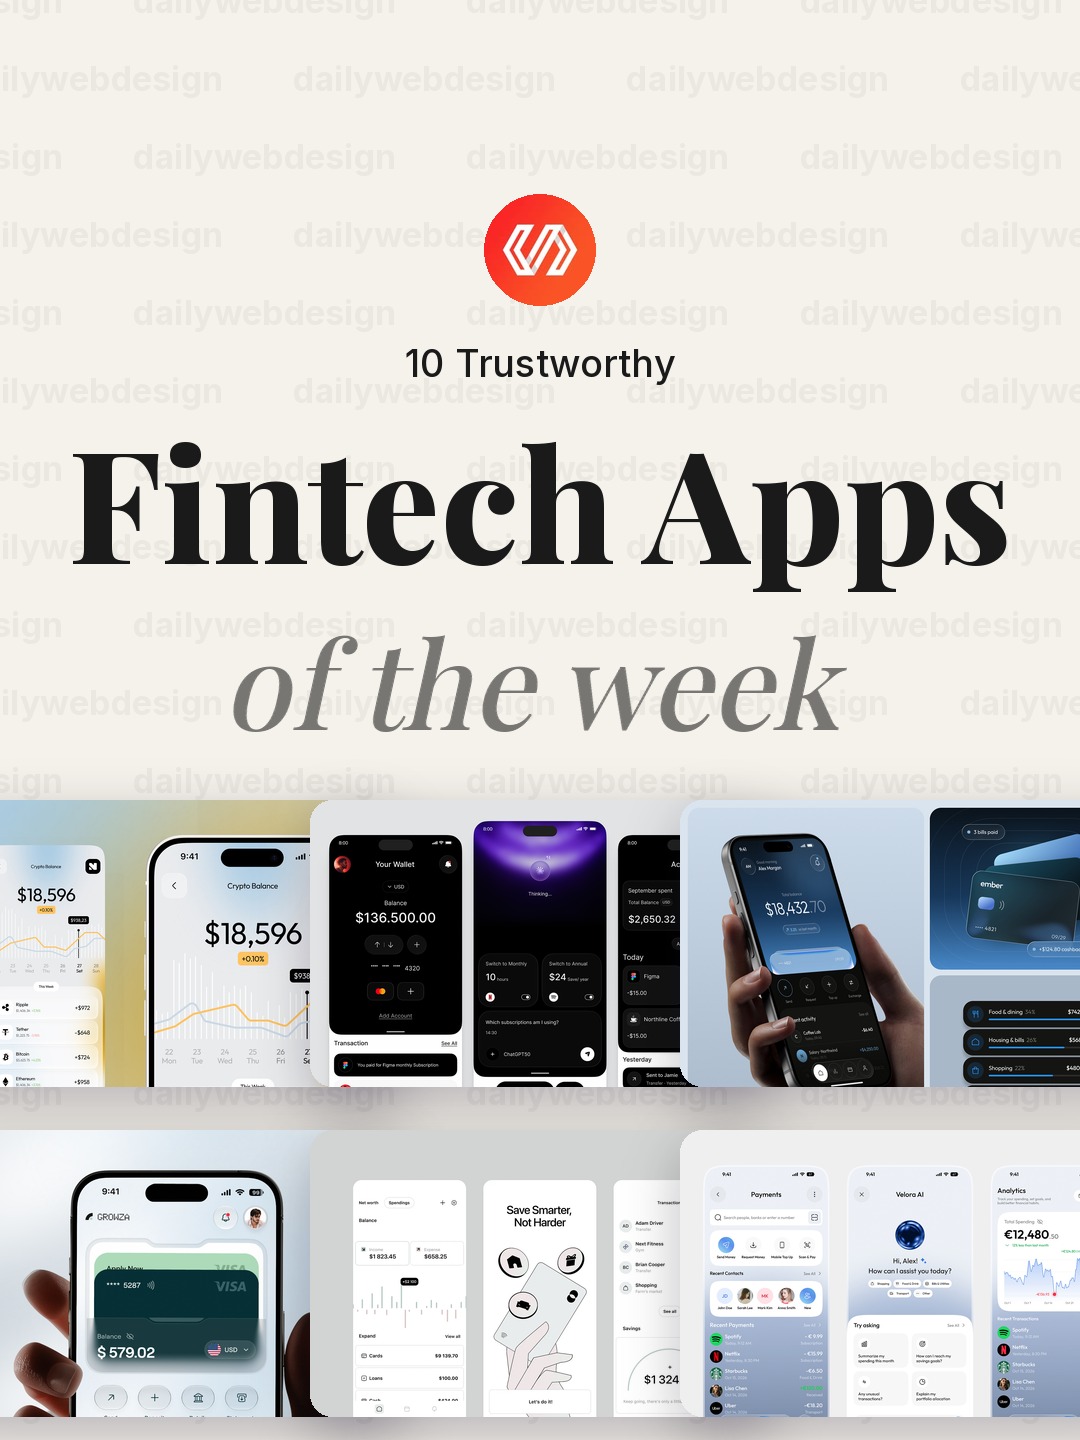
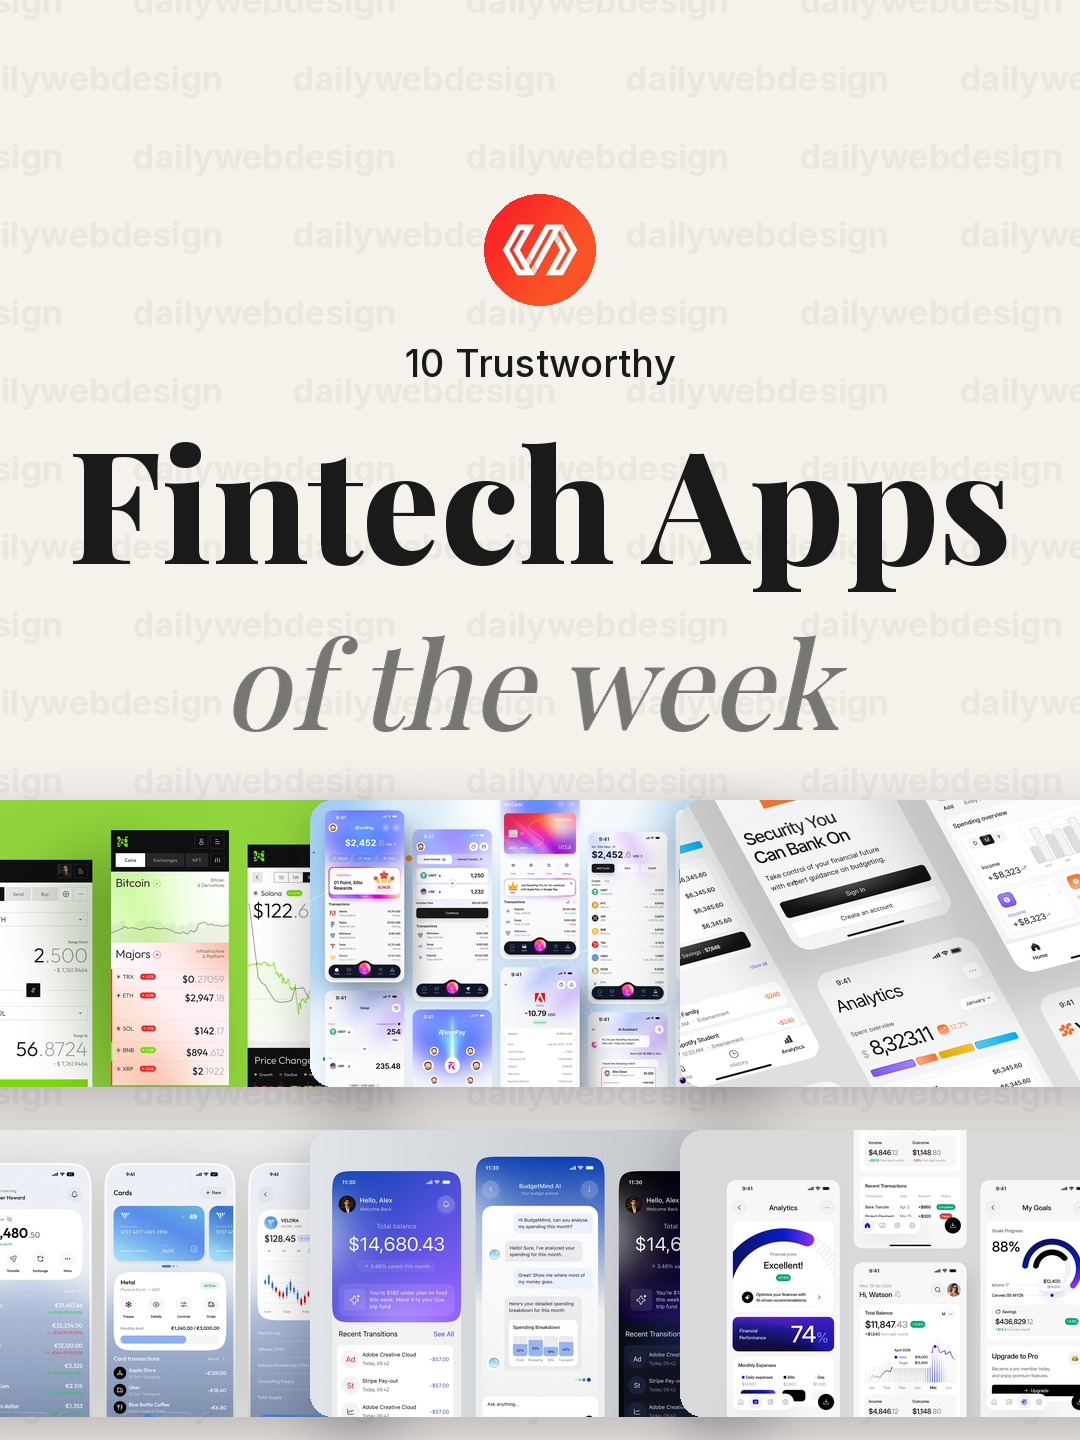
10 Trustworthy Fintech Apps Designs to Learn From (October 2026)
Ten fintech app designs cover banking, payments, personal finance, and investing, with practical interface patterns to borrow. Explore the full collection, designer credits, and cast your vote.
5 min read · Oct 30, 2026
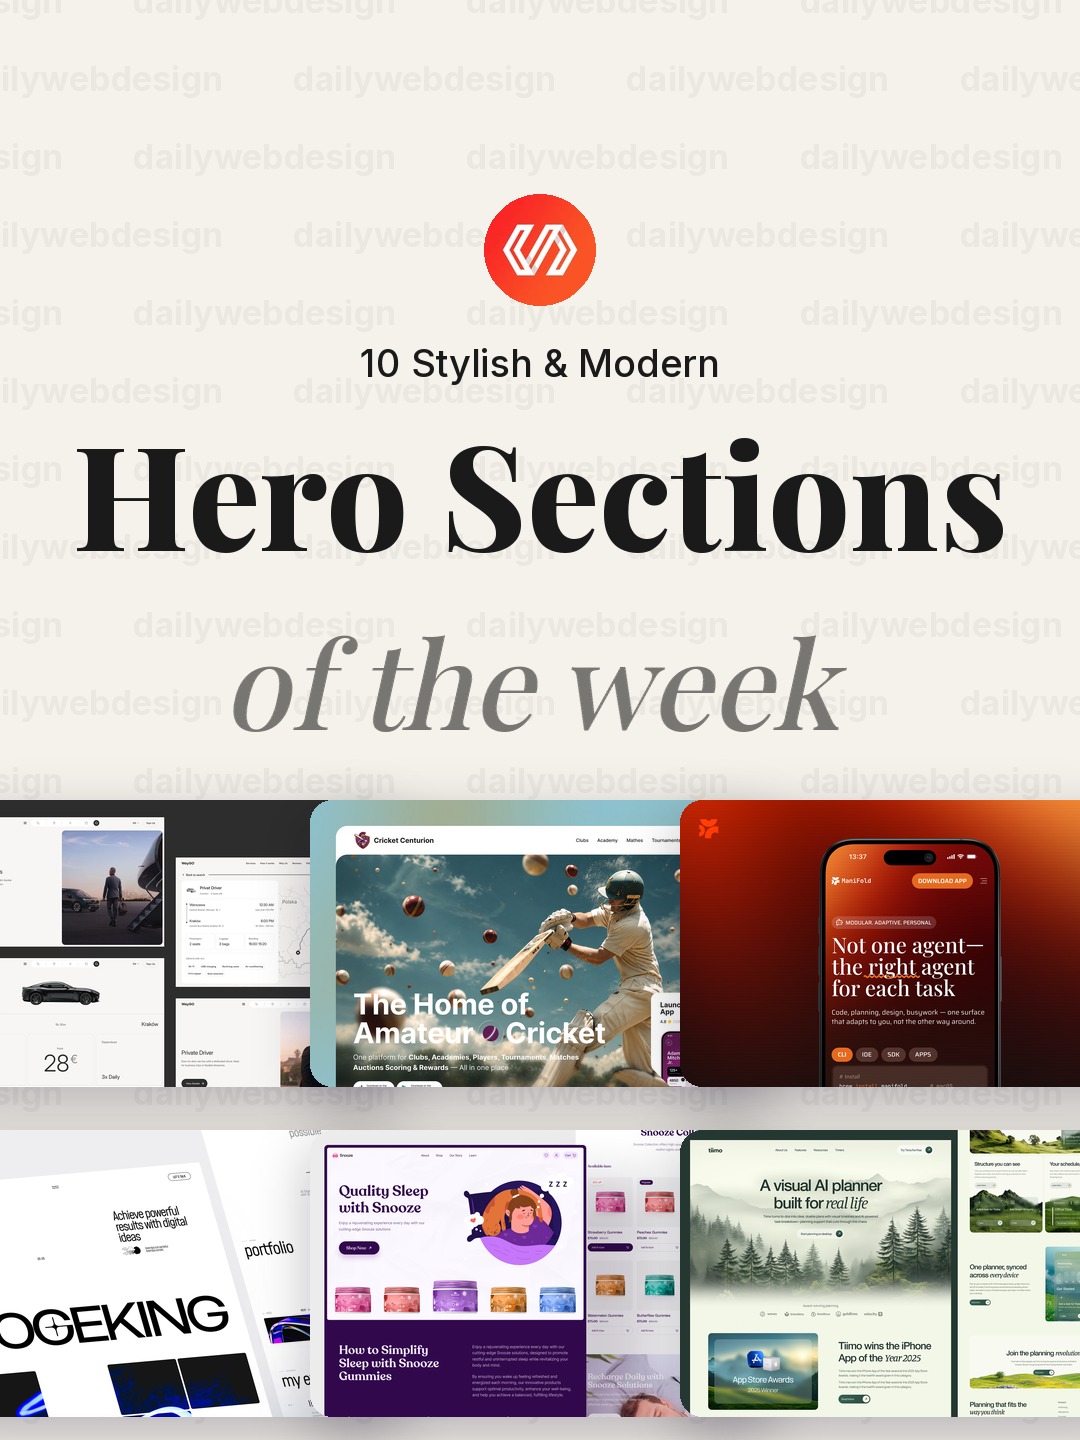
10 Stylish & Modern Hero Section Designs to Learn From (October 2026)
Explore 10 popular Dribbble hero section designs, from logistics and sport to AI, commerce, and biotech. Each example offers a practical idea you can adapt to make your website’s first screen clearer.
5 min read · Oct 28, 2026