
10 Clean & Data-rich Dashboards to Learn From (October 2026)
Dashboards are where complex products turn data into decisions. This week's Dribbble collection spans investing, recruiting, legal work, personal finance, project management, agriculture, and revenue, but the same test applies to each: can someone see what matters and know what to do next? These are the 10 clean and data-rich dashboard designs in this week's roundup.
1. Investor Reporting Dashboard by NexUX Lab
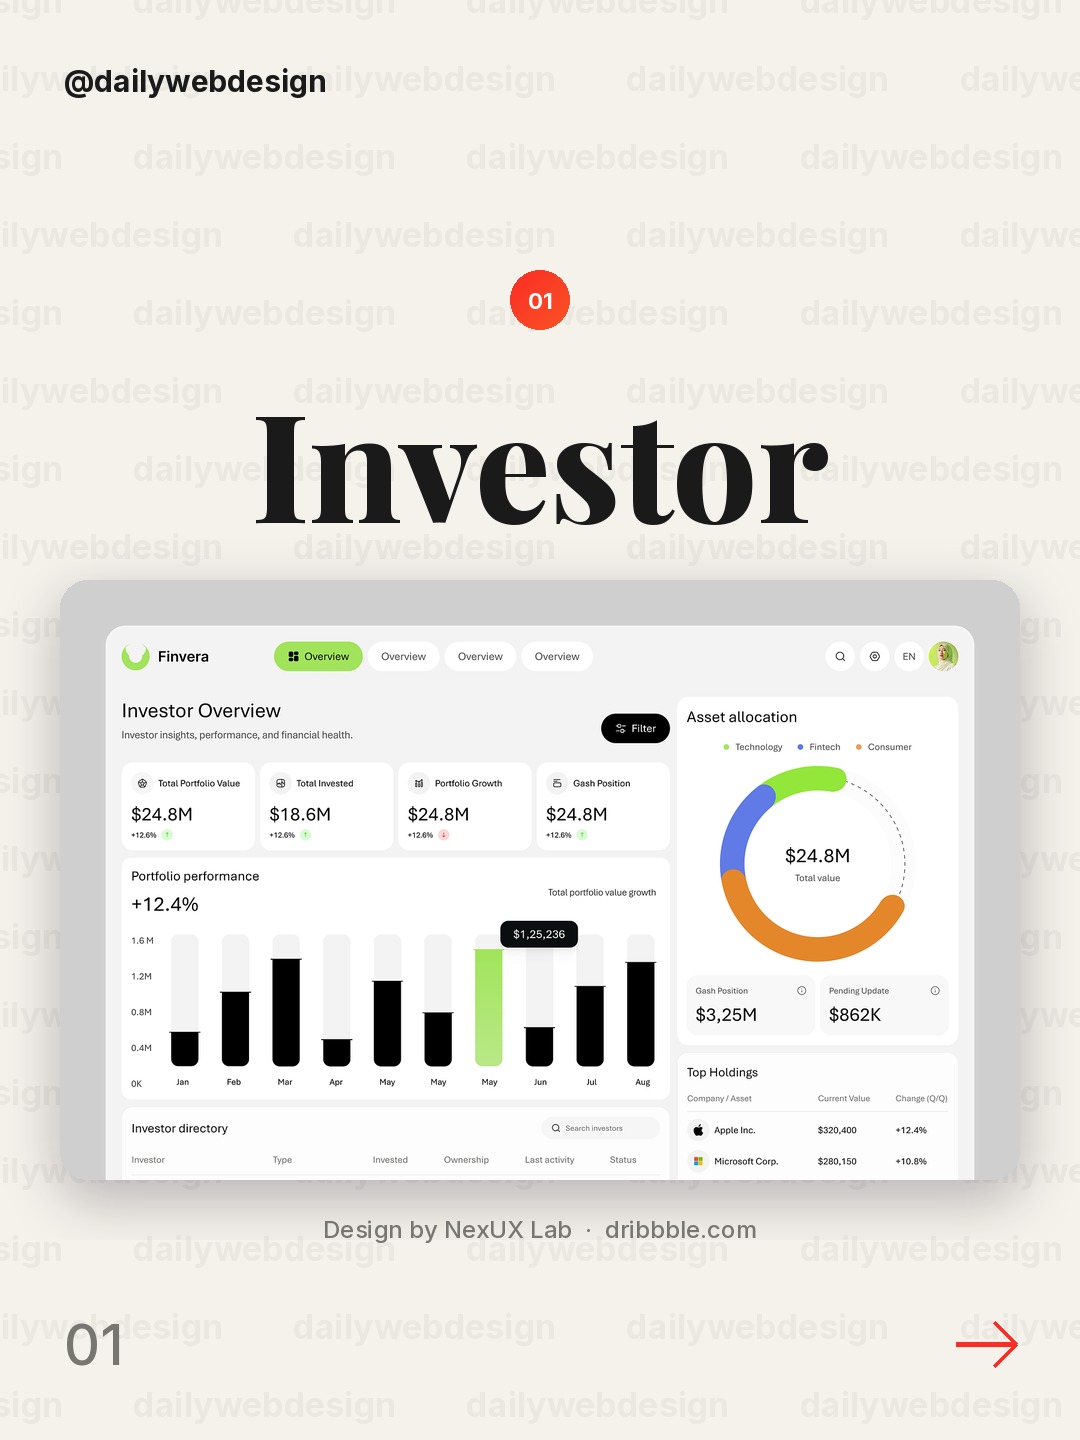
Design by NexUX Lab, via Dribbble
Lead with the number that changes a decision, then make the reporting period and comparison easy to find. A compact portfolio summary can earn its space when it connects performance to the next question an investor is likely to ask.
2. Vestmark · Investor dashboard by Flair
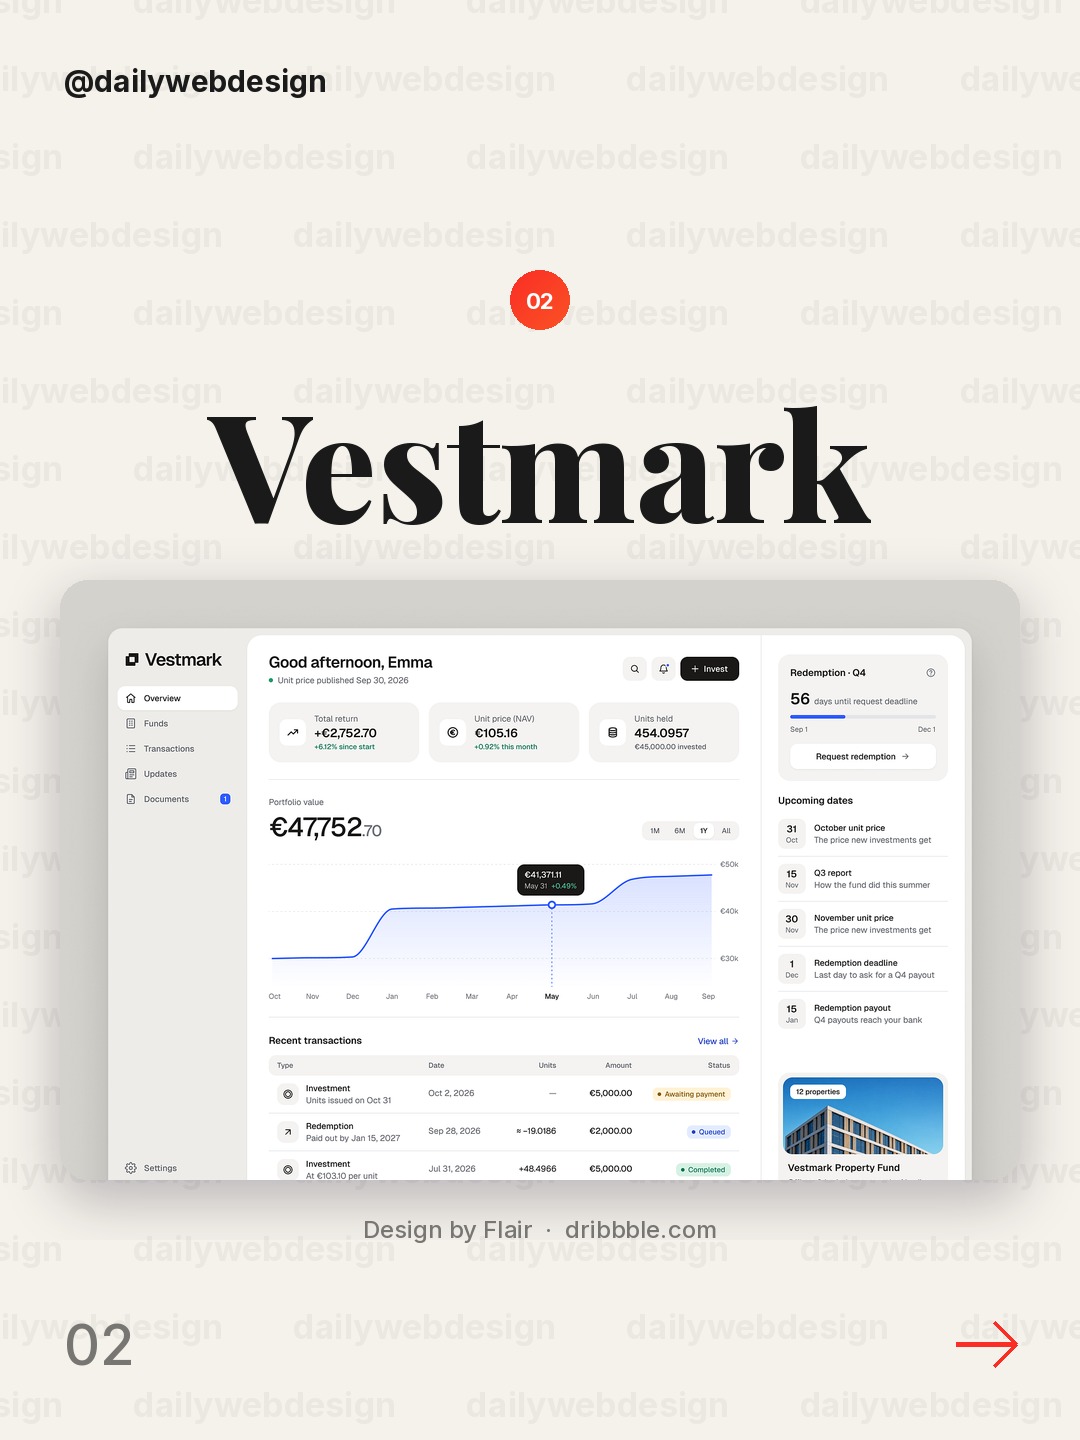
This investor view shows why a dashboard should make its information hierarchy do real work. Separate headline performance from supporting detail, and keep labels close to the figures they explain so a quick scan does not become a decoding exercise.
3. Recruitment Dashboard Employees screen by Awe Design Studio
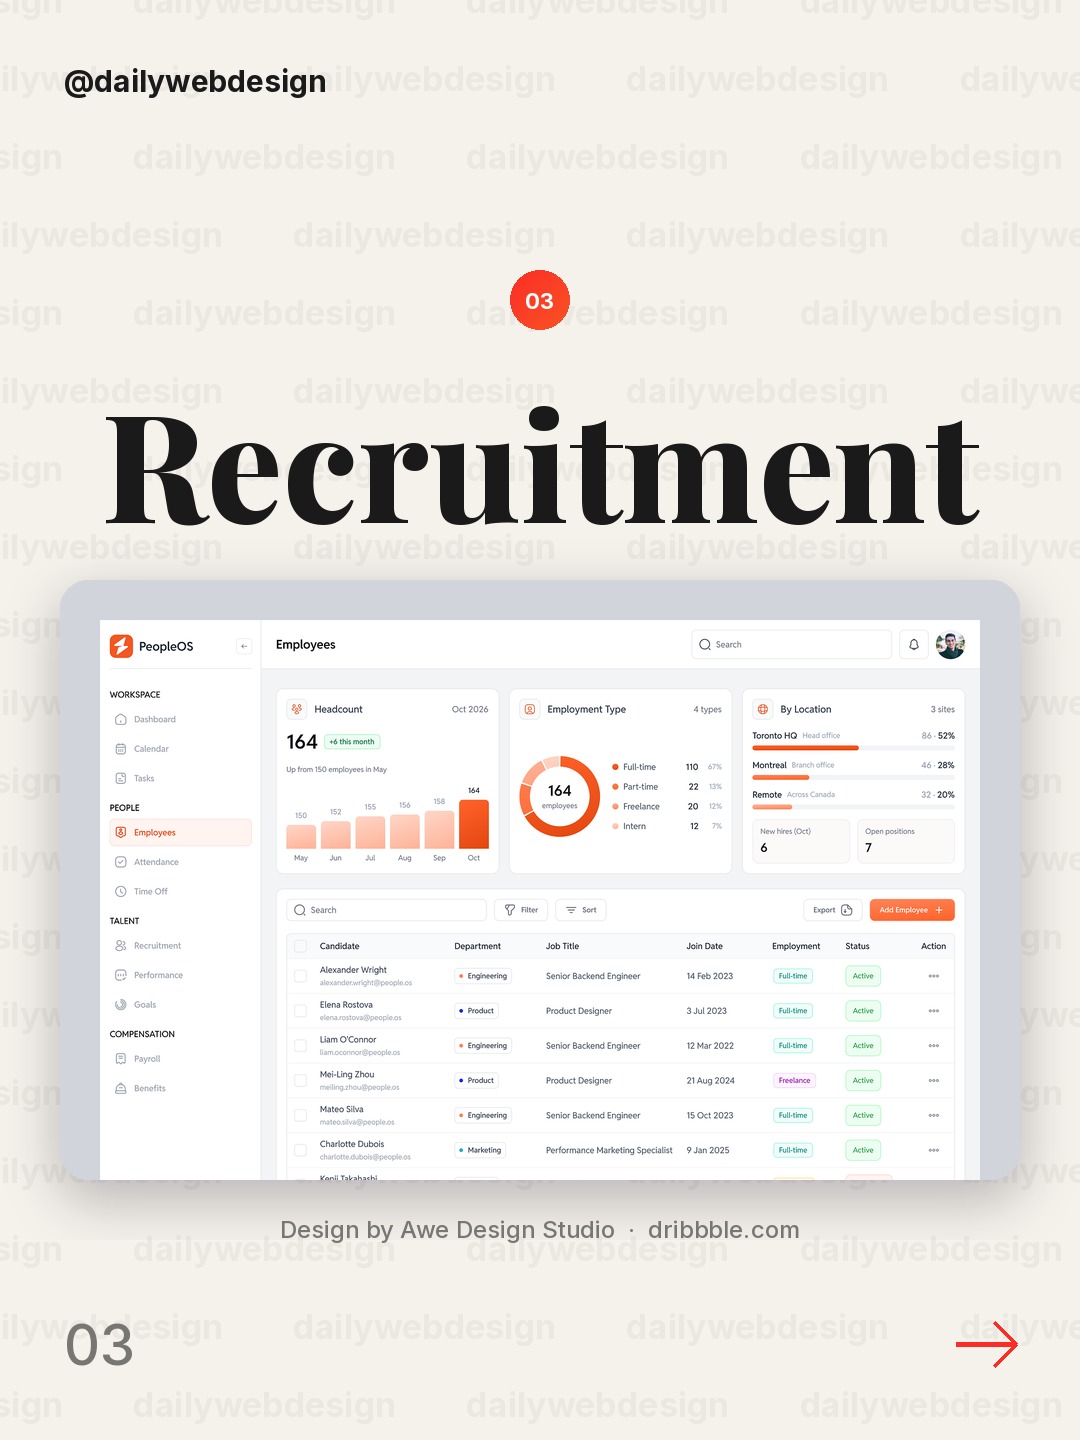
Design by Awe Design Studio, via Dribbble
Recruitment workflows involve both people and pipeline stages, so the useful pattern here is to show the team view without losing the individual record. Use consistent status cues and clear ownership, then let filters narrow the list instead of hiding the overall workload.
4. Legal SaaS Admin Dashboard UI UX | Law firm document marketplace by Musemind
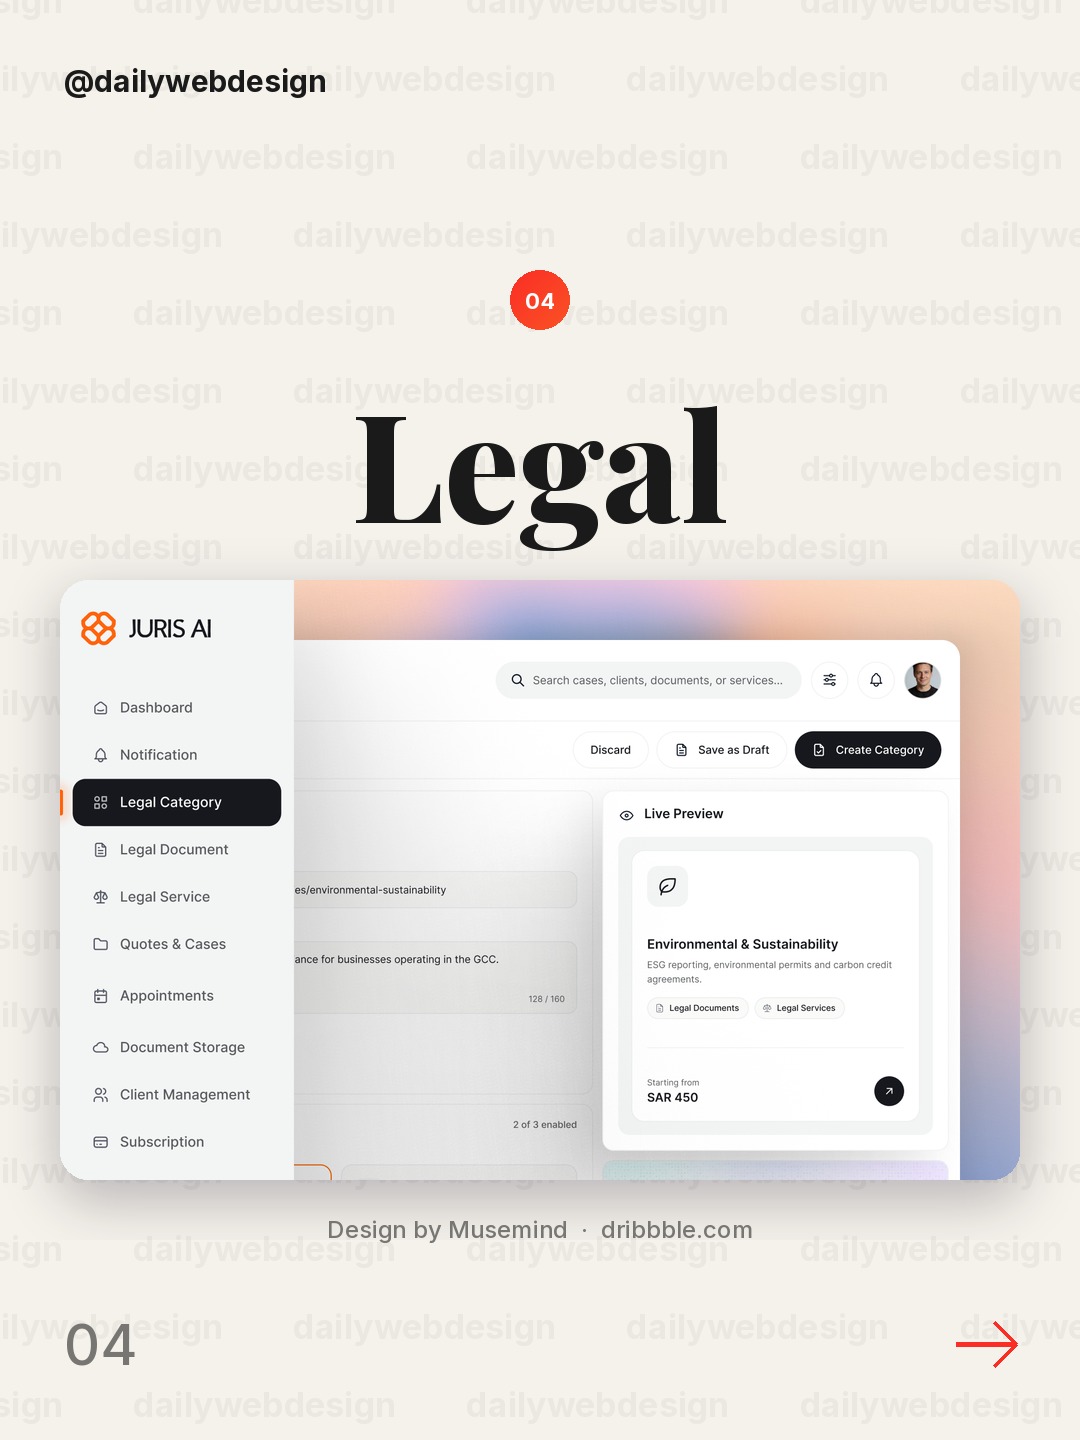
Design by Musemind, via Dribbble
Legal operations have dense documents and consequential states. This kind of admin screen benefits from strong grouping, readable metadata, and unmistakable actions; make the document's status and next step visible before adding secondary controls.
5. Finley — Personal Finance Dashboard by Gurvinder Singh
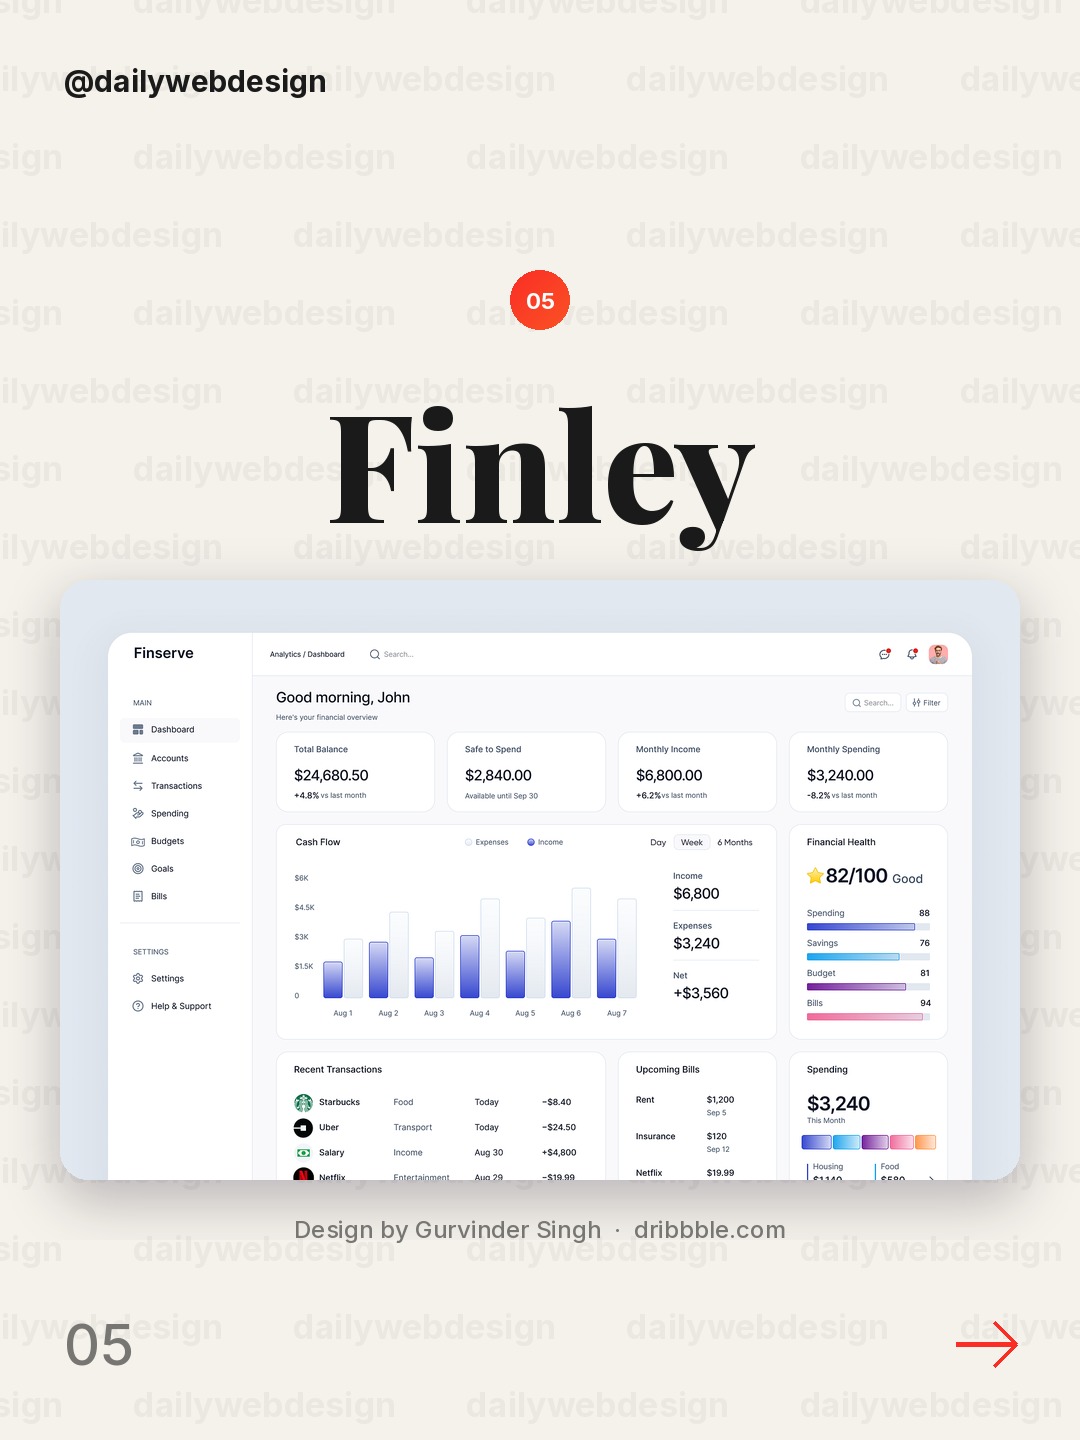
Design by Gurvinder Singh, via Dribbble
Personal finance is easier to understand when a balance is paired with a time period and a useful breakdown. Keep the high-level picture calm, then let a chart answer one specific question rather than decorating the page with unrelated trends.
6. Project Management & Team Collaboration Dashboard by Hatypo Studio
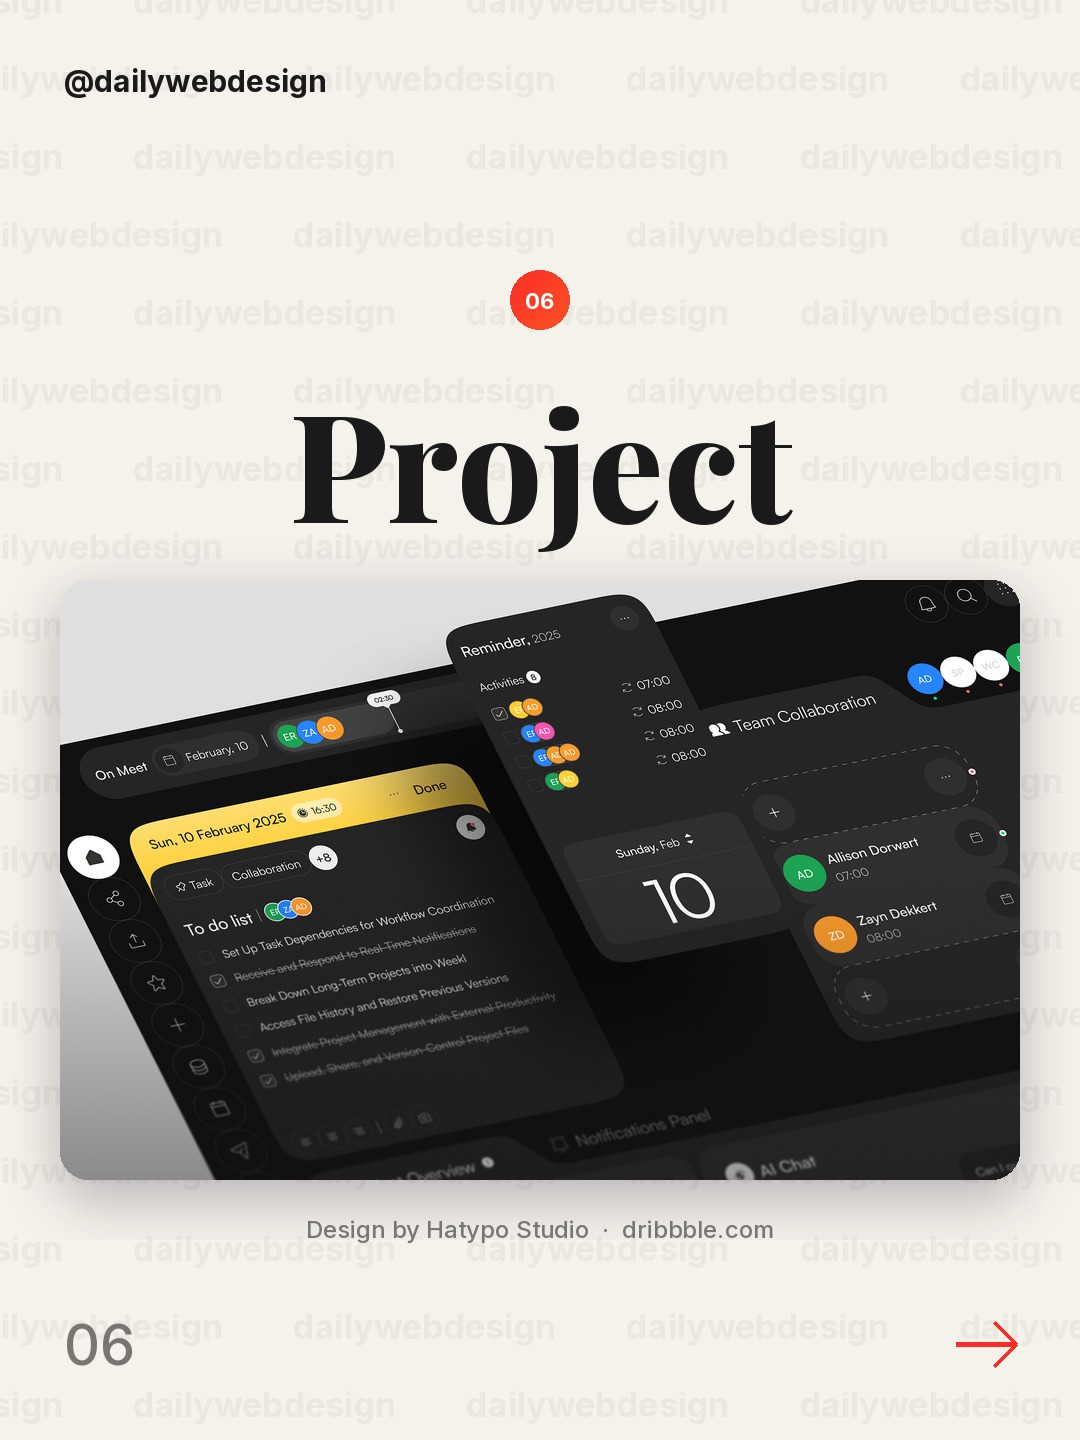
Design by Hatypo Studio, via Dribbble
Project dashboards need to connect tasks to people and deadlines. A useful layout keeps progress, ownership, and upcoming work in the same visual neighborhood, while making collaboration details available without crowding the main status view.
7. Moonetra — Finance & Analytics Dashboard by Vektora
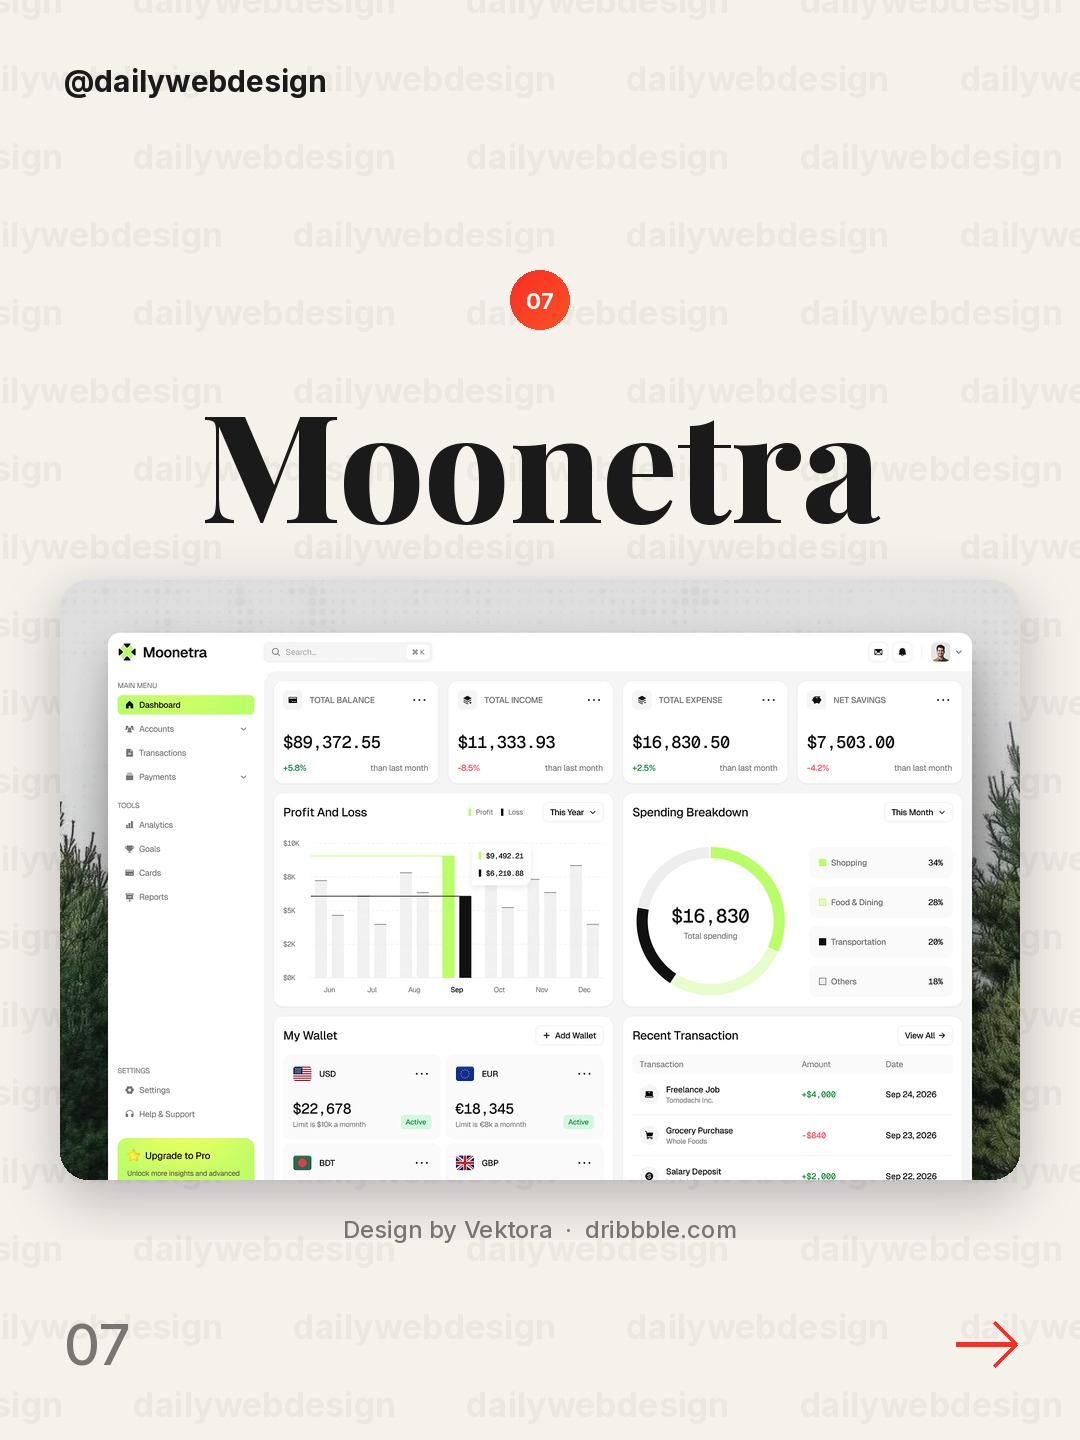
Design by Vektora, via Dribbble
Finance and analytics screens can become a wall of numbers unless they establish a clear reading order. Use a small set of prominent metrics, consistent chart scales, and restrained color so changes stand out for a reason.
8. Teras - Agriculture Dashboard by Cansaas
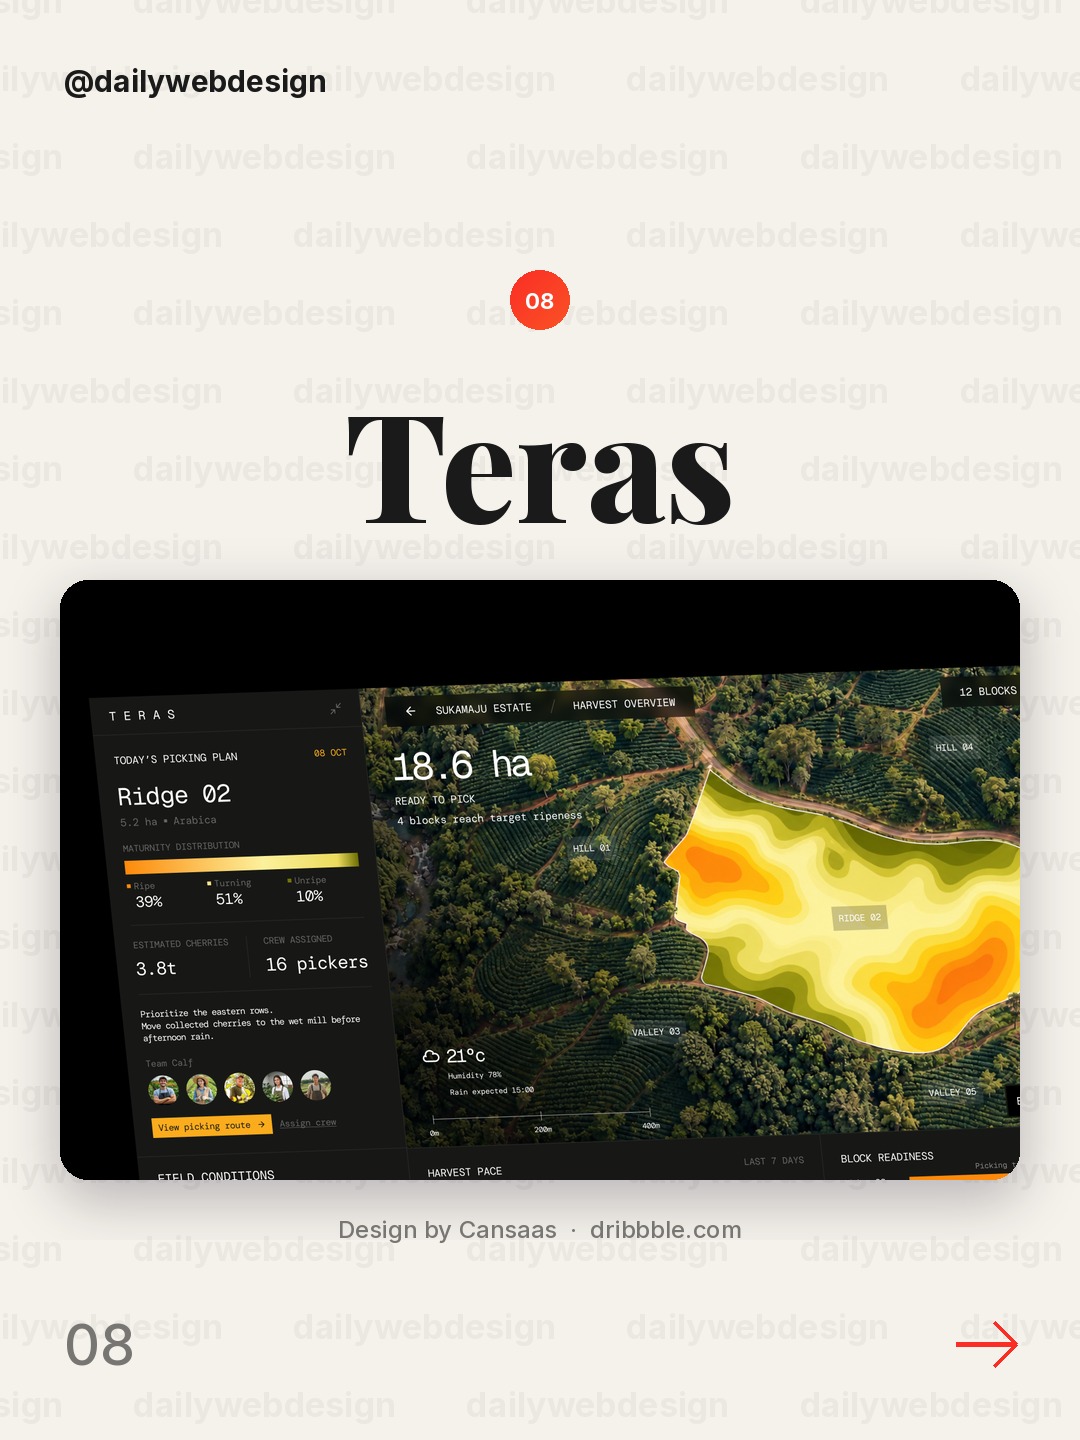
Design by Cansaas, via Dribbble
An agriculture dashboard has to translate operational data into decisions, not just display it. Pair a broad overview with clear units and time context, and reserve stronger visual emphasis for conditions that call for attention.
9. Revenue dashboard — Untitled UI by Jordan Hughes®
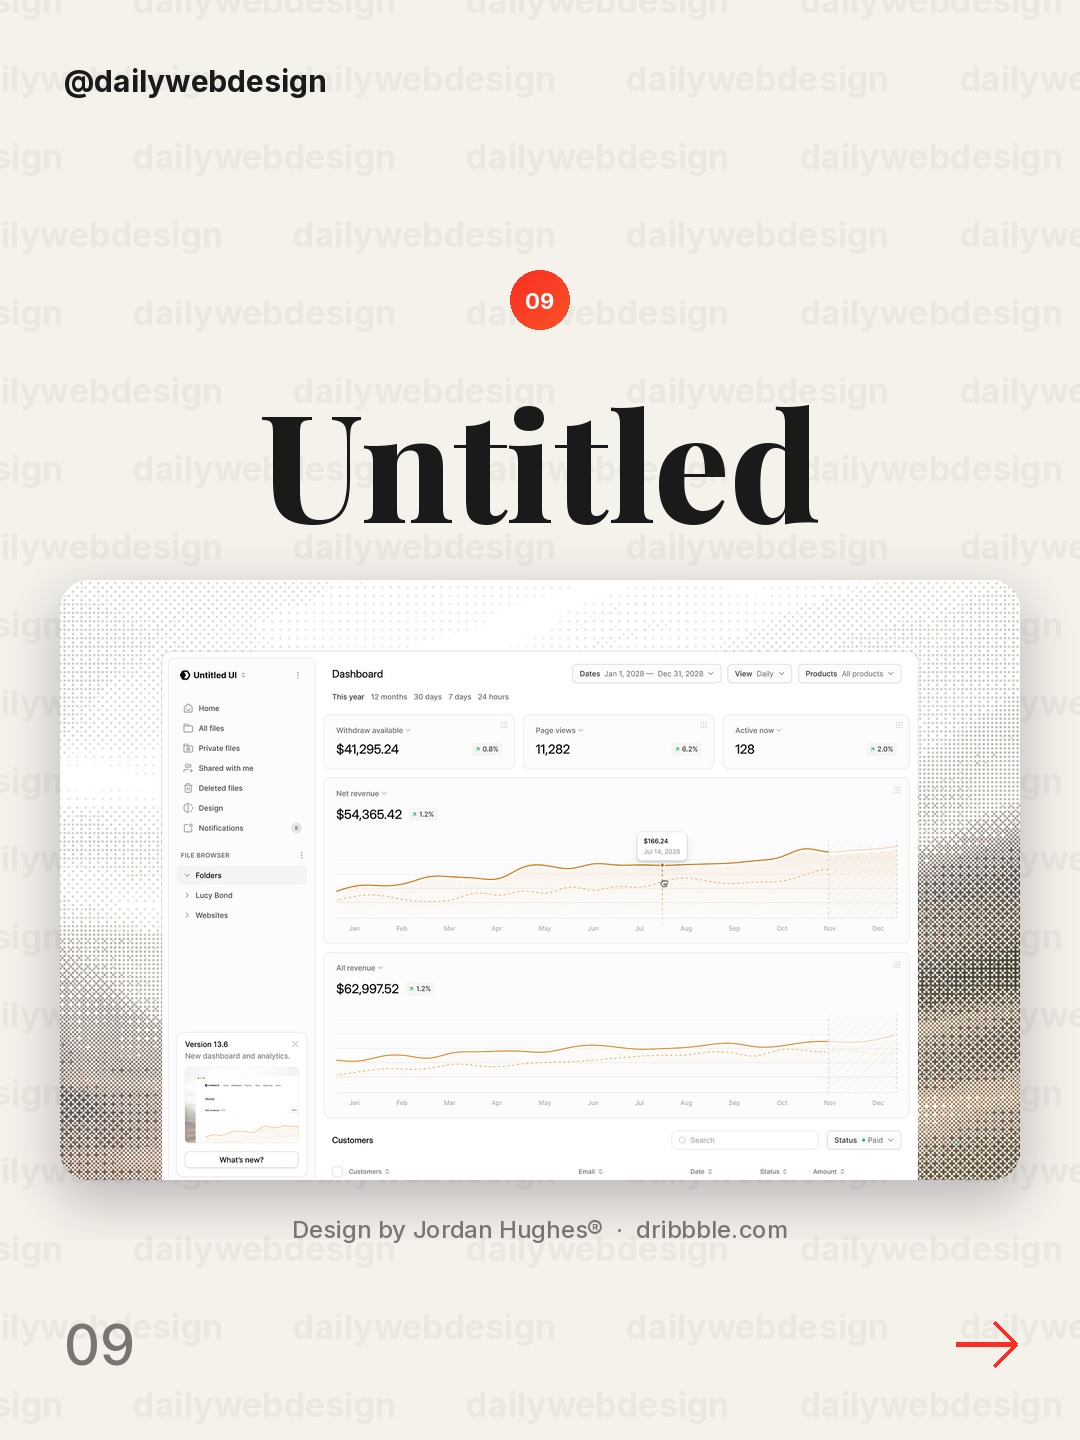
Design by Jordan Hughes®, via Dribbble
Revenue reporting is most useful when teams can connect the total to its drivers. Keep the headline figure prominent, make the period and comparison explicit, and use a small number of well-labeled breakdowns to explain movement.
10. Dashboard UI Design by Mahid
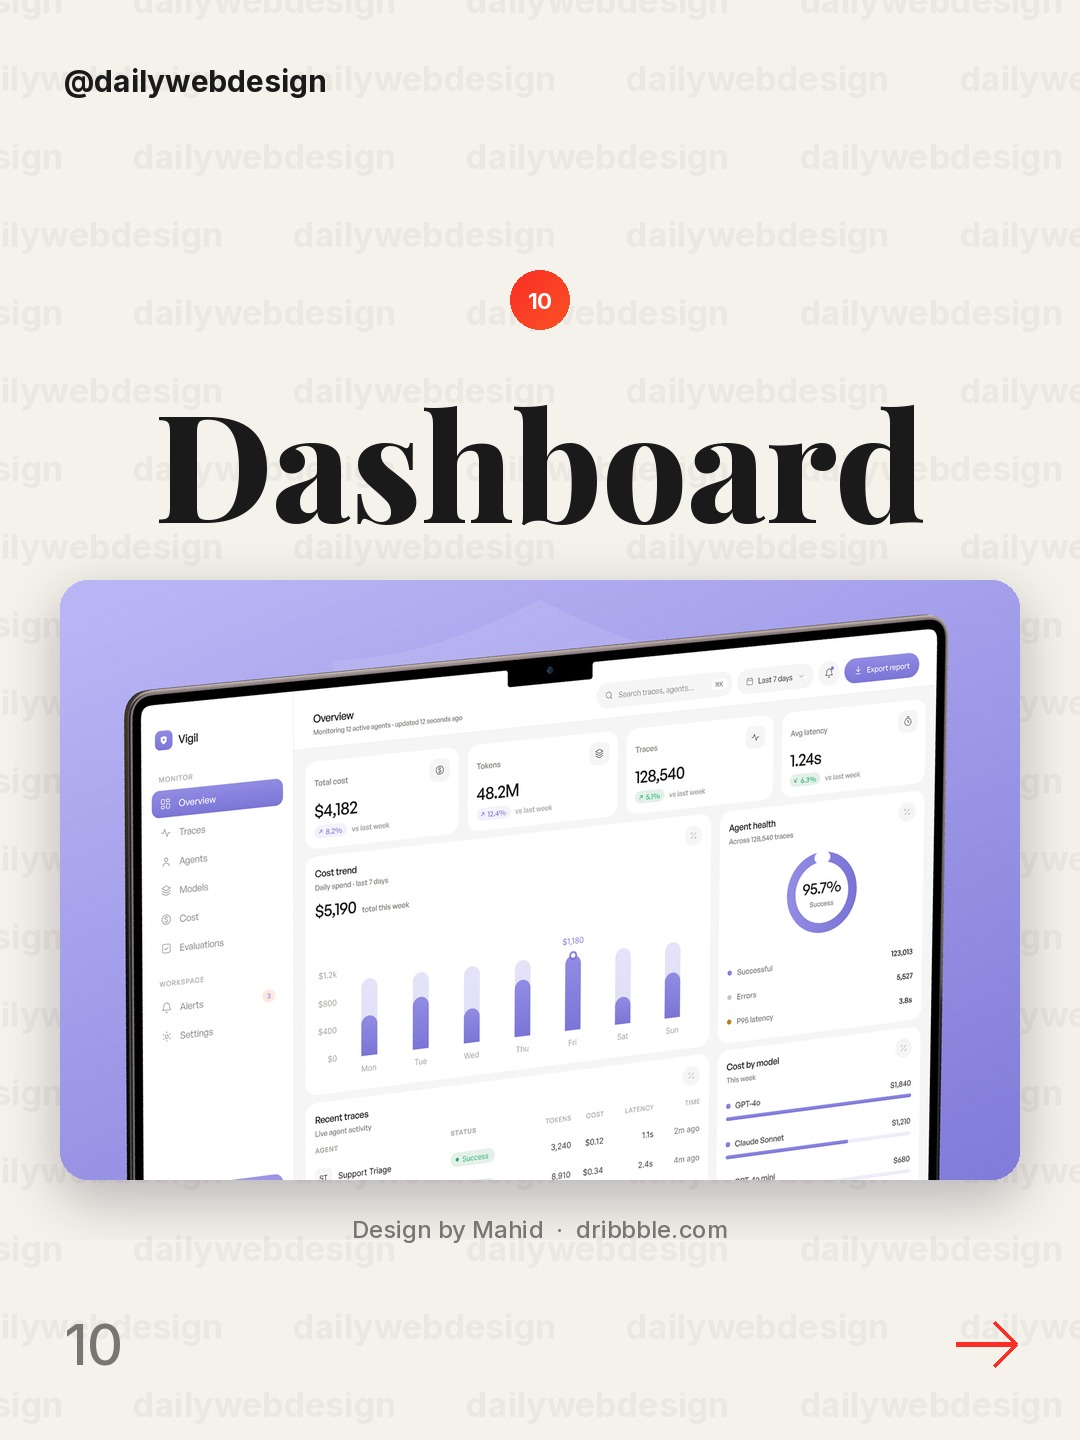
A broad dashboard concept is a reminder to start with the user's recurring questions. Pick a few indicators that answer those questions, make every chart understandable on its own, and remove widgets that do not change what someone does next.
What I would copy this week
First, give the primary metric a clear period and comparison. Second, organize supporting information around a real task or decision instead of filling every available space. Third, use color and chart emphasis consistently, so an alert or change earns attention rather than competing with everything else.
Want to put a design idea into practice? Explore the NewForm monthly challenges.
Related on NewForm
Keep reading
Which one is your favorite?
Pick the shot you would save. One vote per visitor.
Investor Reporting Dashboard
Design by NexUX LabVestmark · Investor dashboard
Design by FlairRecruitment Dashboard Employees screen
Design by Awe Design StudioLegal SaaS Admin Dashboard UI UX | Law firm document marketplace
Design by MusemindFinley — Personal Finance Dashboard
Design by Gurvinder SinghProject Management & Team Collaboration Dashboard
Design by Hatypo StudioMoonetra — Finance & Analytics Dashboard
Design by VektoraTeras - Agriculture Dashboard
Design by CansaasRevenue dashboard — Untitled UI
Design by Jordan Hughes®Dashboard UI Design
Design by MahidFind Your Stack
Discover the perfect design tools for your workflow.
Take the 60-second quizNewForm Studio
Turn your designs into professional mockups instantly.
Open StudioMore from NewForm
10 Trustworthy Fintech Apps Designs to Learn From (October 2026)
Ten fintech app designs cover banking, payments, personal finance, and investing, with practical interface patterns to borrow. Explore the full collection, designer credits, and cast your vote.
5 min read · Oct 30, 2026
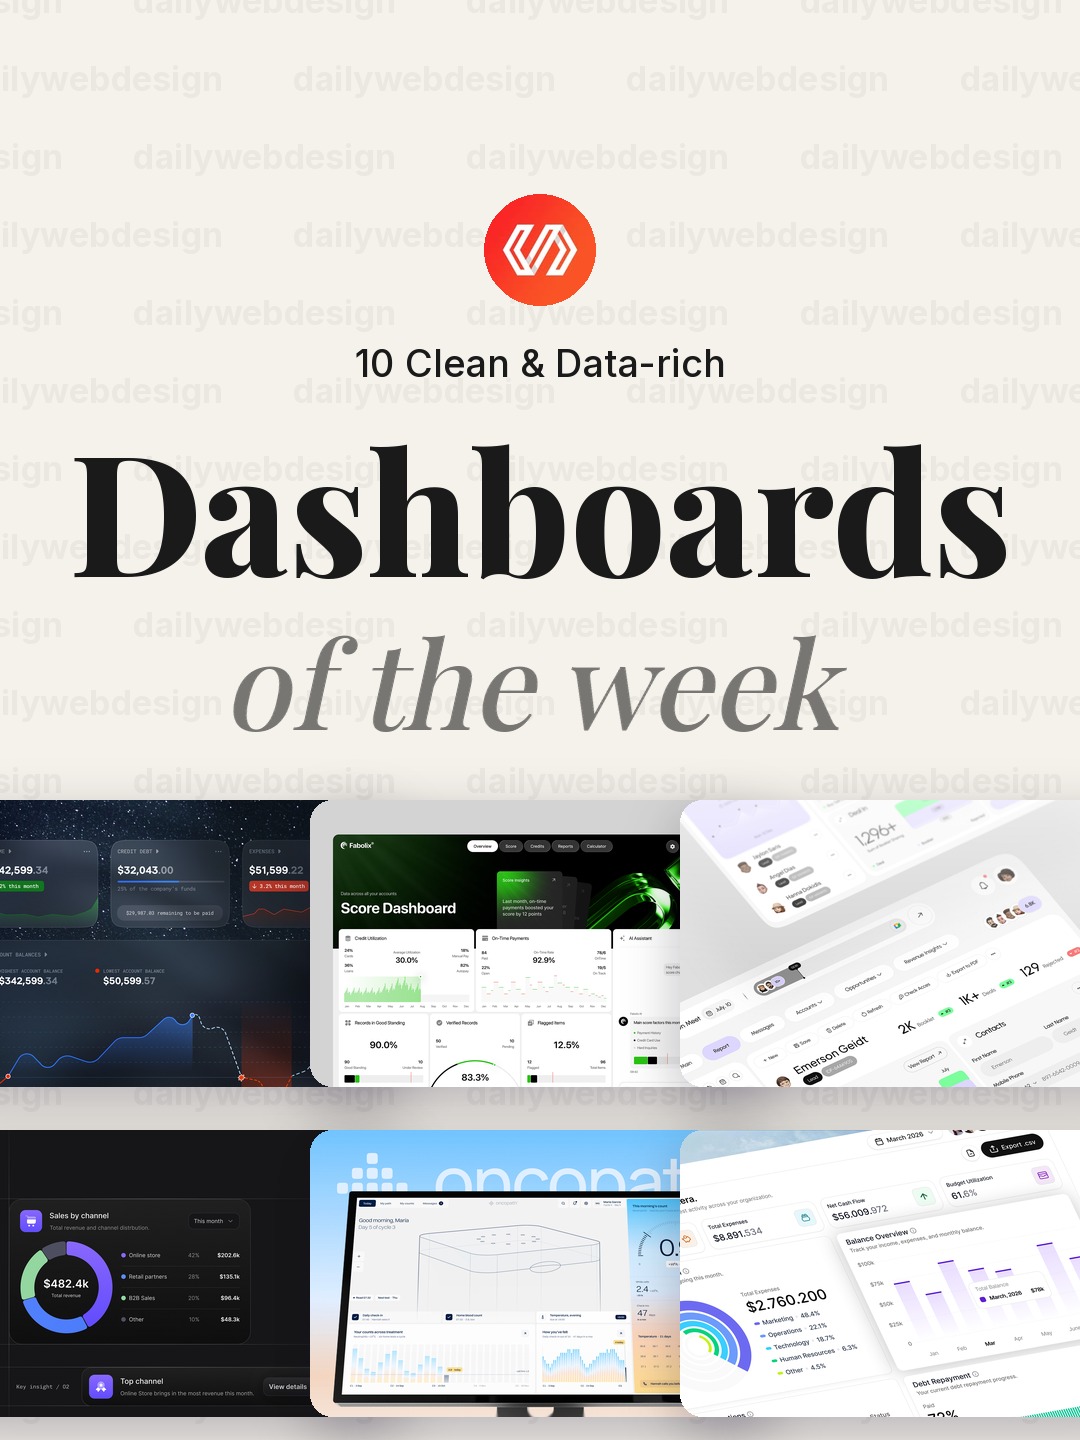
10 Clean Dashboard Designs to Learn From (October 2026)
Ten dashboard designs spanning finance, sales, healthcare, security, and monitoring, with practical interface patterns to borrow. Explore the full collection, designer credits, and cast your vote.
5 min read · Oct 29, 2026